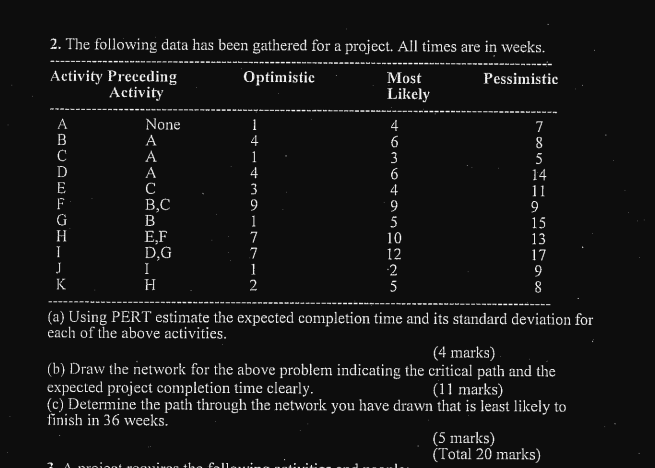
Question: 2. The following data has been gathered for a project. All times are in weeks. Activity Preceding Optimistic Most Pessimistic Activity Likely A None 1

2. The following data has been gathered for a

2. The following data has been gathered for a project. All times are in weeks. Activity Preceding Optimistic Most Pessimistic Activity Likely A None 1 4 7 B 6 8 1 3 5 D 6 14 E C 3 4 11 B,C 9 9 9 G B 1 5 15 H E,F 7 10 13 I DG 7 12 17 J I 1 9 K H 2 5 8 (a) Using PERT estimate the expected completion time and its standard deviation for each of the above activities. (4 marks) (b) Draw the network for the above problem indicating the critical path and the expected project completion time clearly. (11 marks) (C) Determine the path through the network you have drawn that is least likely to finish in 36 weeks. (5 marks) (Total 20 marks) 7 proiont own the follow

Step by Step Solution

There are 3 Steps involved in it

1 Expert Approved Answer
Step: 1 Unlock blur-text-image
Question Has Been Solved by an Expert!

Get step-by-step solutions from verified subject matter experts

Step: 2 Unlock
Step: 3 Unlock

Students Have Also Explored These Related General Management Questions!