

Question: 2. The following data is the heights (in nearest centimeters) of 85 employees in a company 169 179 183 186 166 181 177 173 167
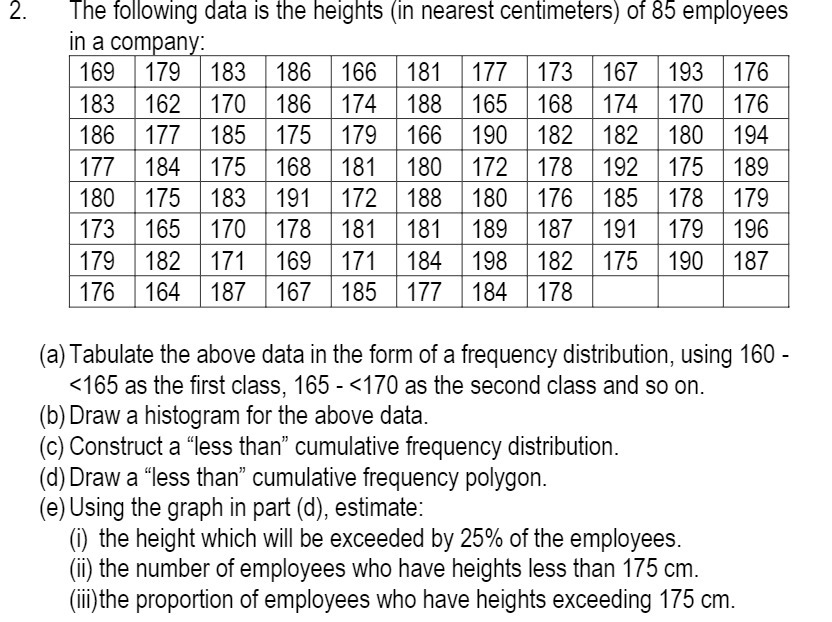
2. The following data is the heights (in nearest centimeters) of 85 employees in a company 169 179 183 186 166 181 177 173 167 193 176 183 162 170 186 174 188 165 168 174 170 176 186 177 185 175 179 166 190 182 182 180 194 177 184 175 168 181 180 172 178 192 175 189 180 175 183 191 172 188 180 176 185 178 179 173 165 170 178 181 181 189 187 191 179 196 179 182 171 169 171 184 198 182 175 190 187 176 164 187 167 185 177 184 178 (a) Tabulate the above data in the form of a frequency distribution, using 160 -
Step by Step Solution
There are 3 Steps involved in it
1 Expert Approved Answer
Step: 1 Unlock

Question Has Been Solved by an Expert!
Get step-by-step solutions from verified subject matter experts
Step: 2 Unlock
Step: 3 Unlock