

Question: You will be given questions about five different clients. Determine the appropriate required minimum distribution as requested. You will need to use one of three
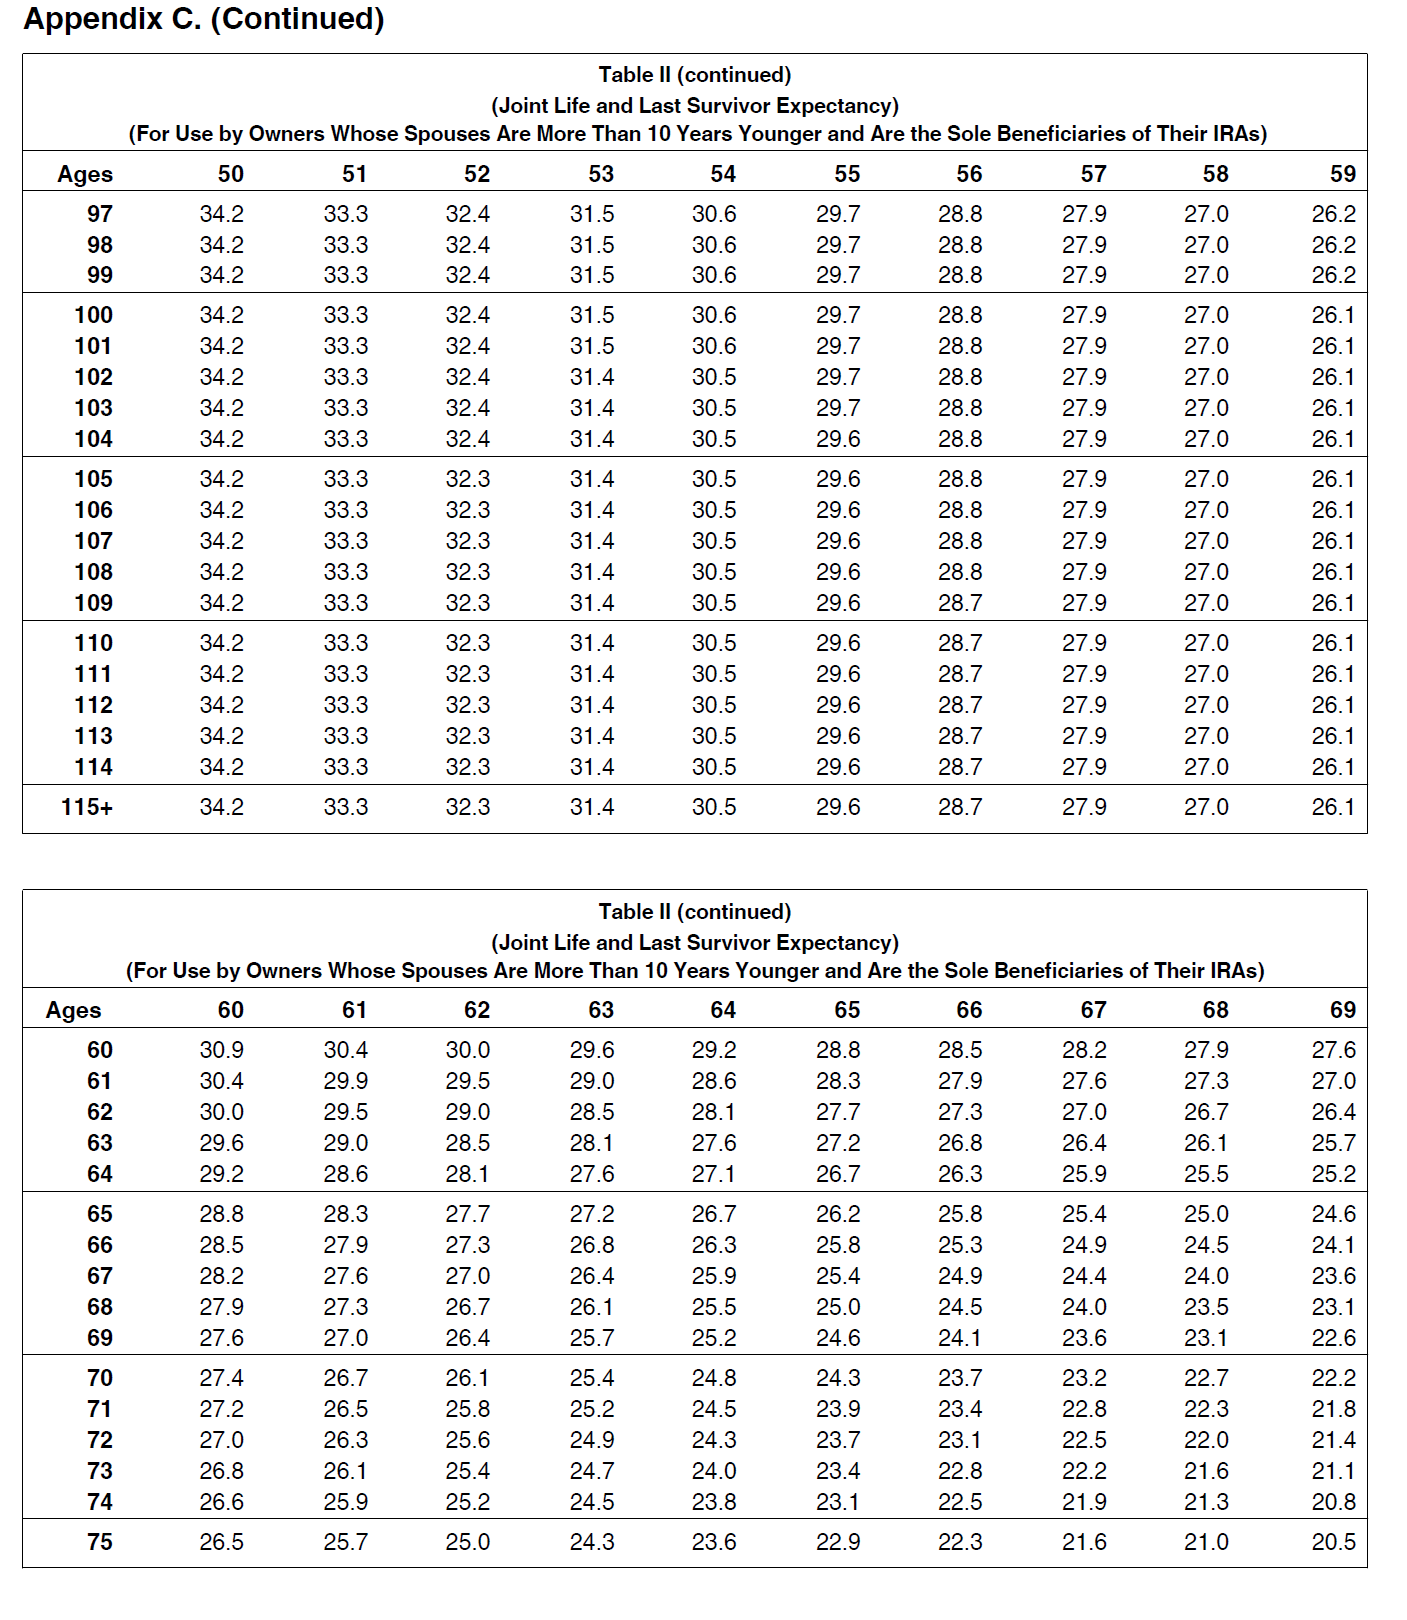
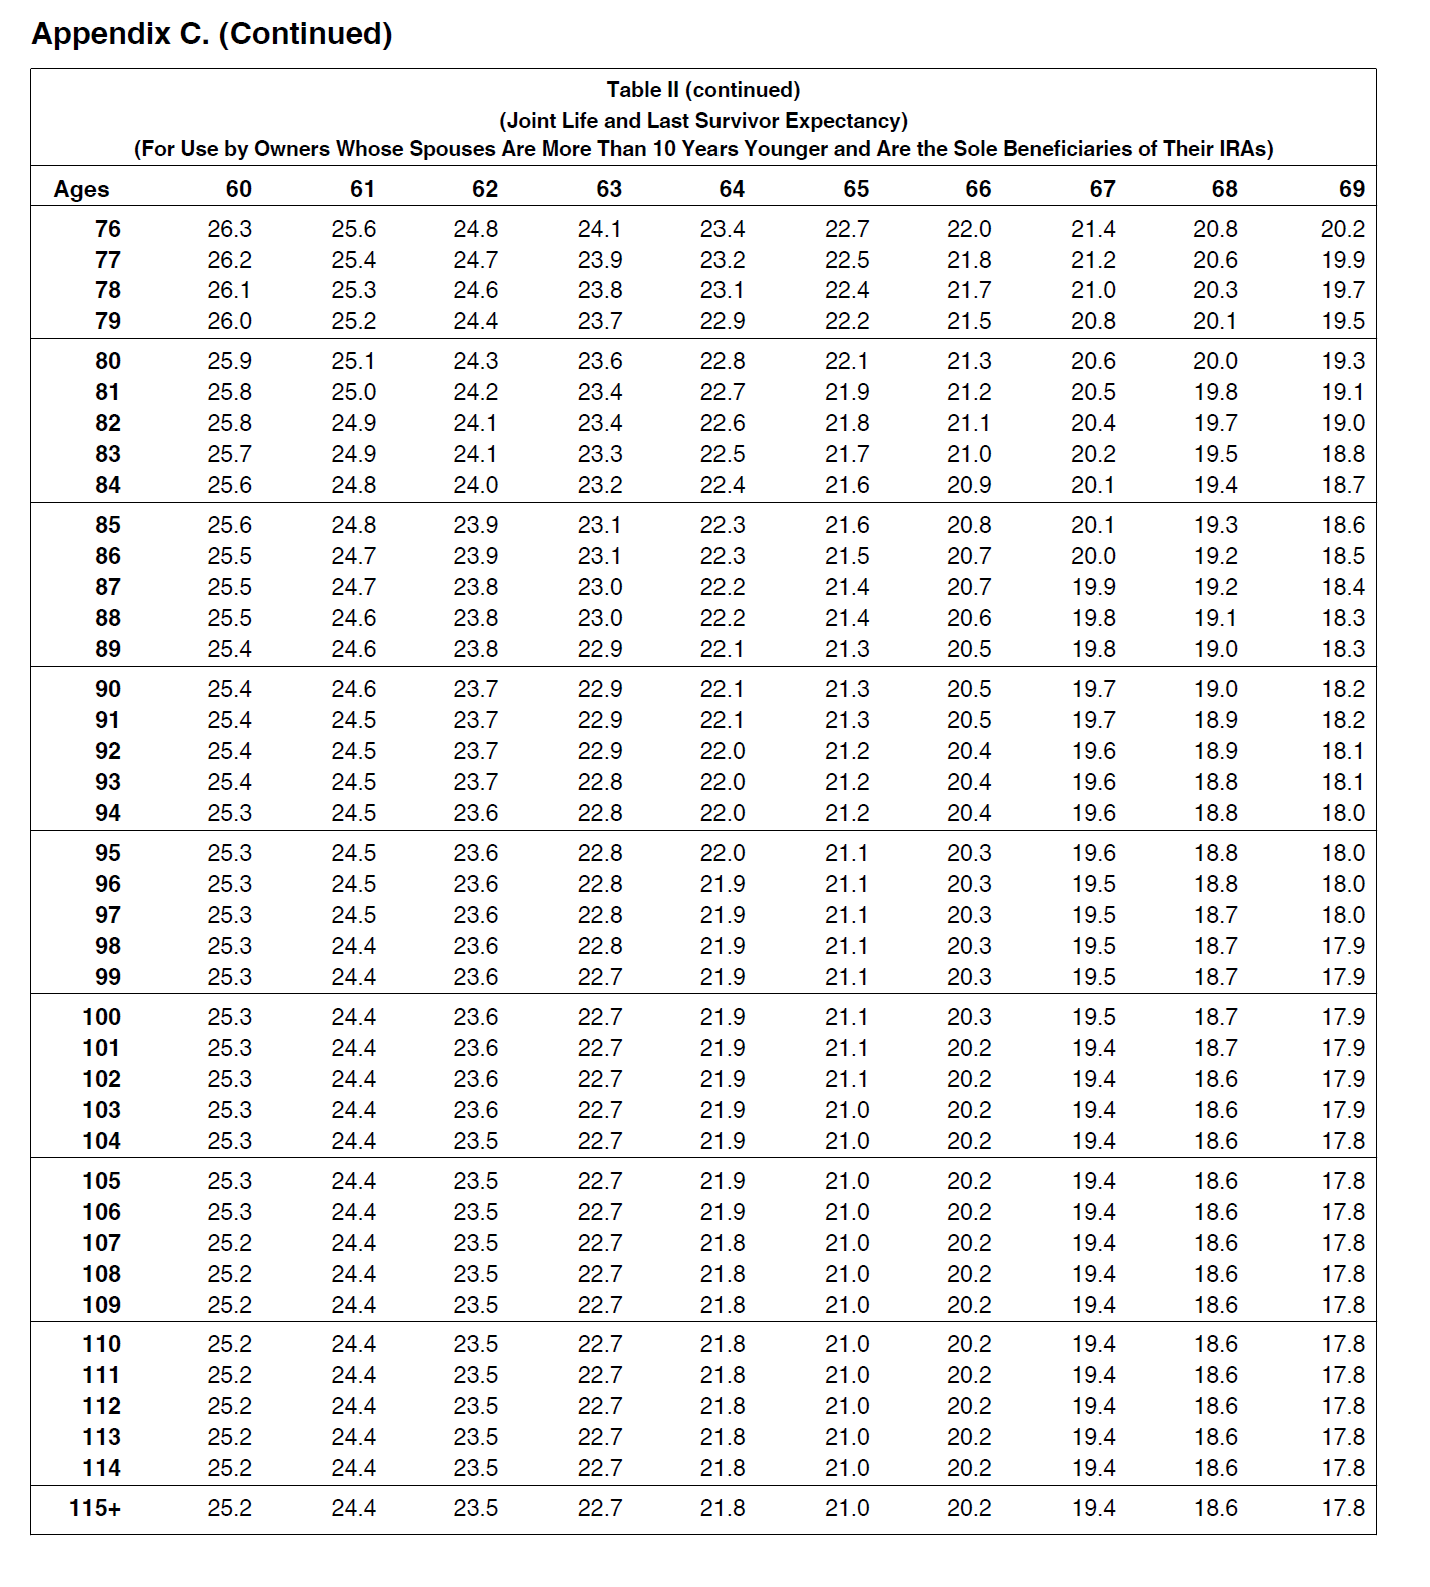

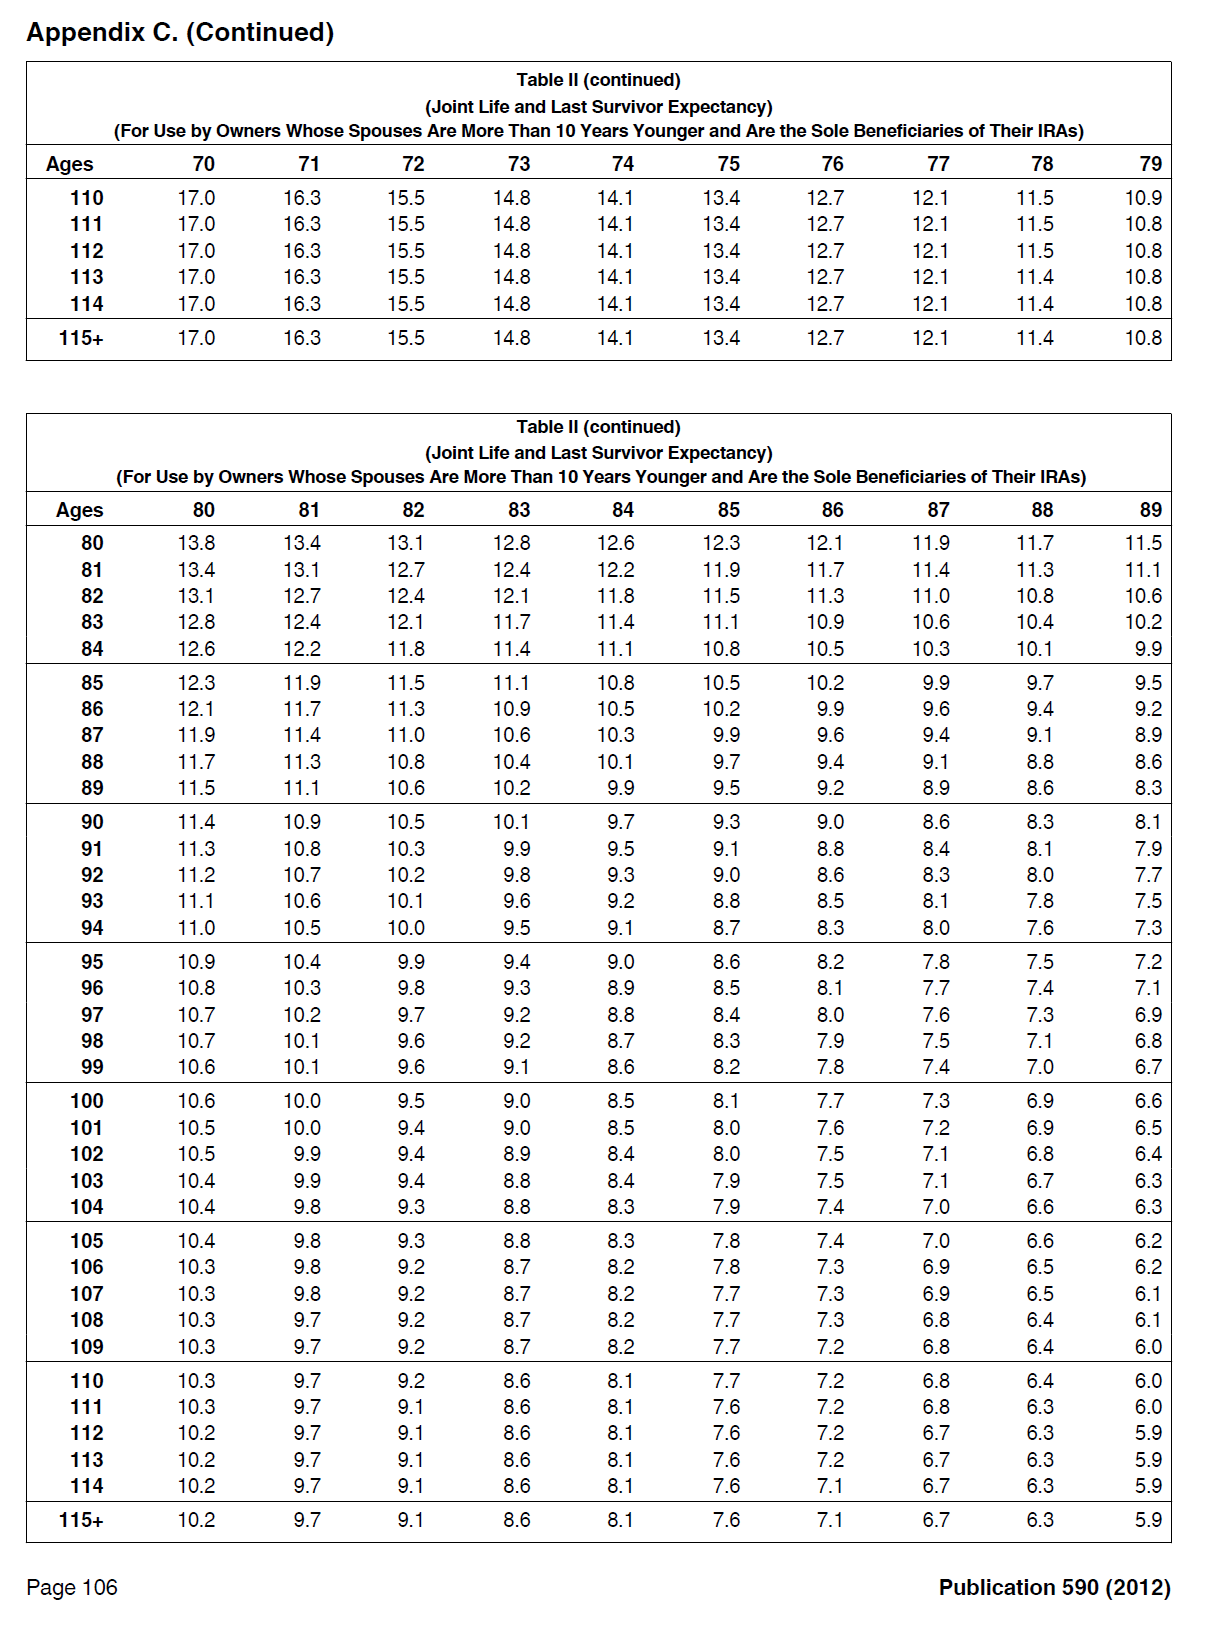

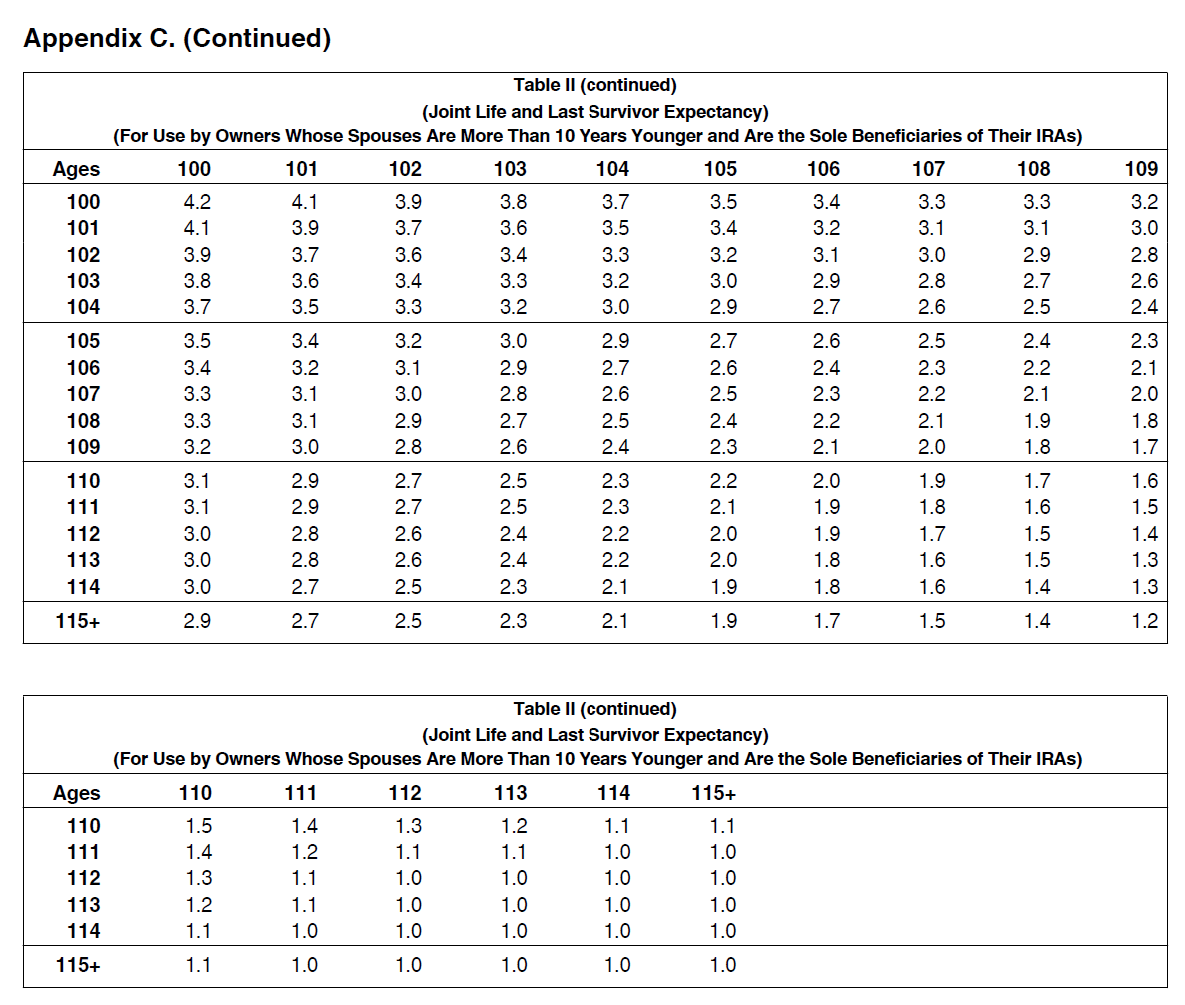
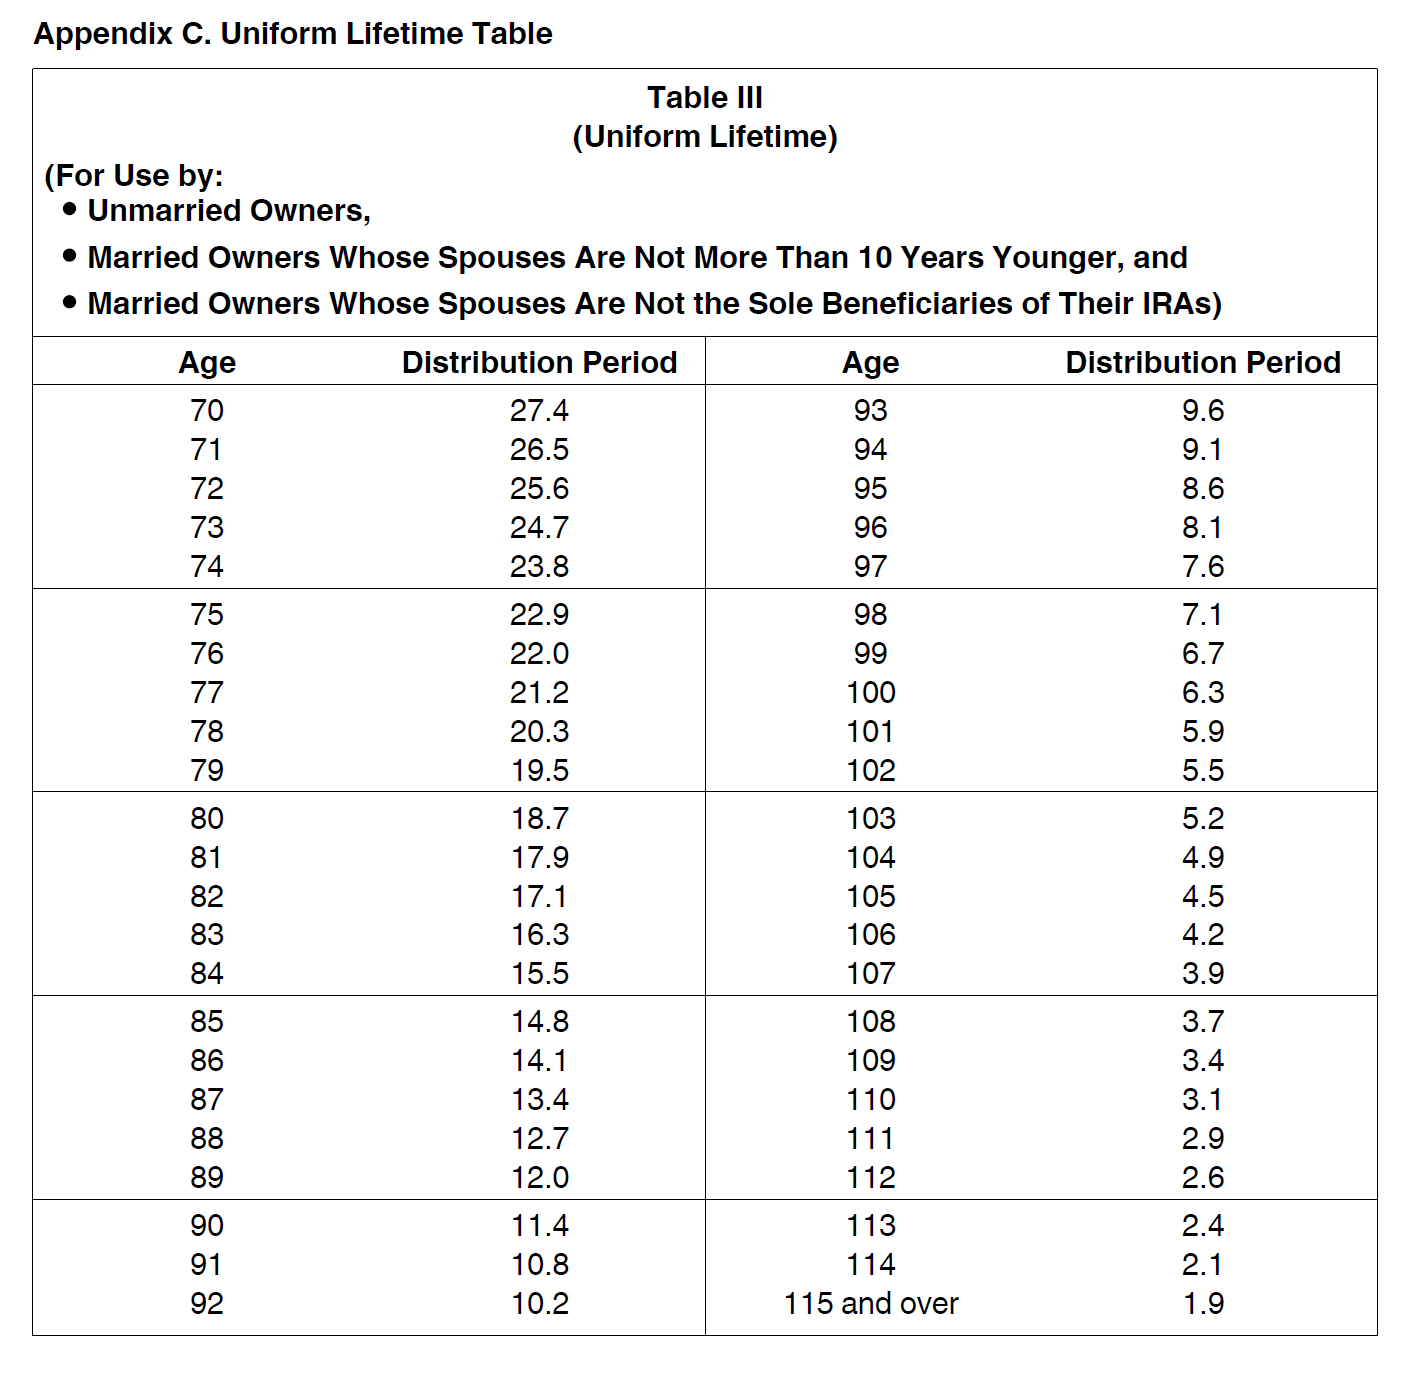
You will be given questions about five different clients. Determine the appropriate required minimum distribution as requested. You will need to use one of three different government tables in your calculations. All three tables come from IRS Publication 590 which governs IRA accounts.Please find these tables attached as images.
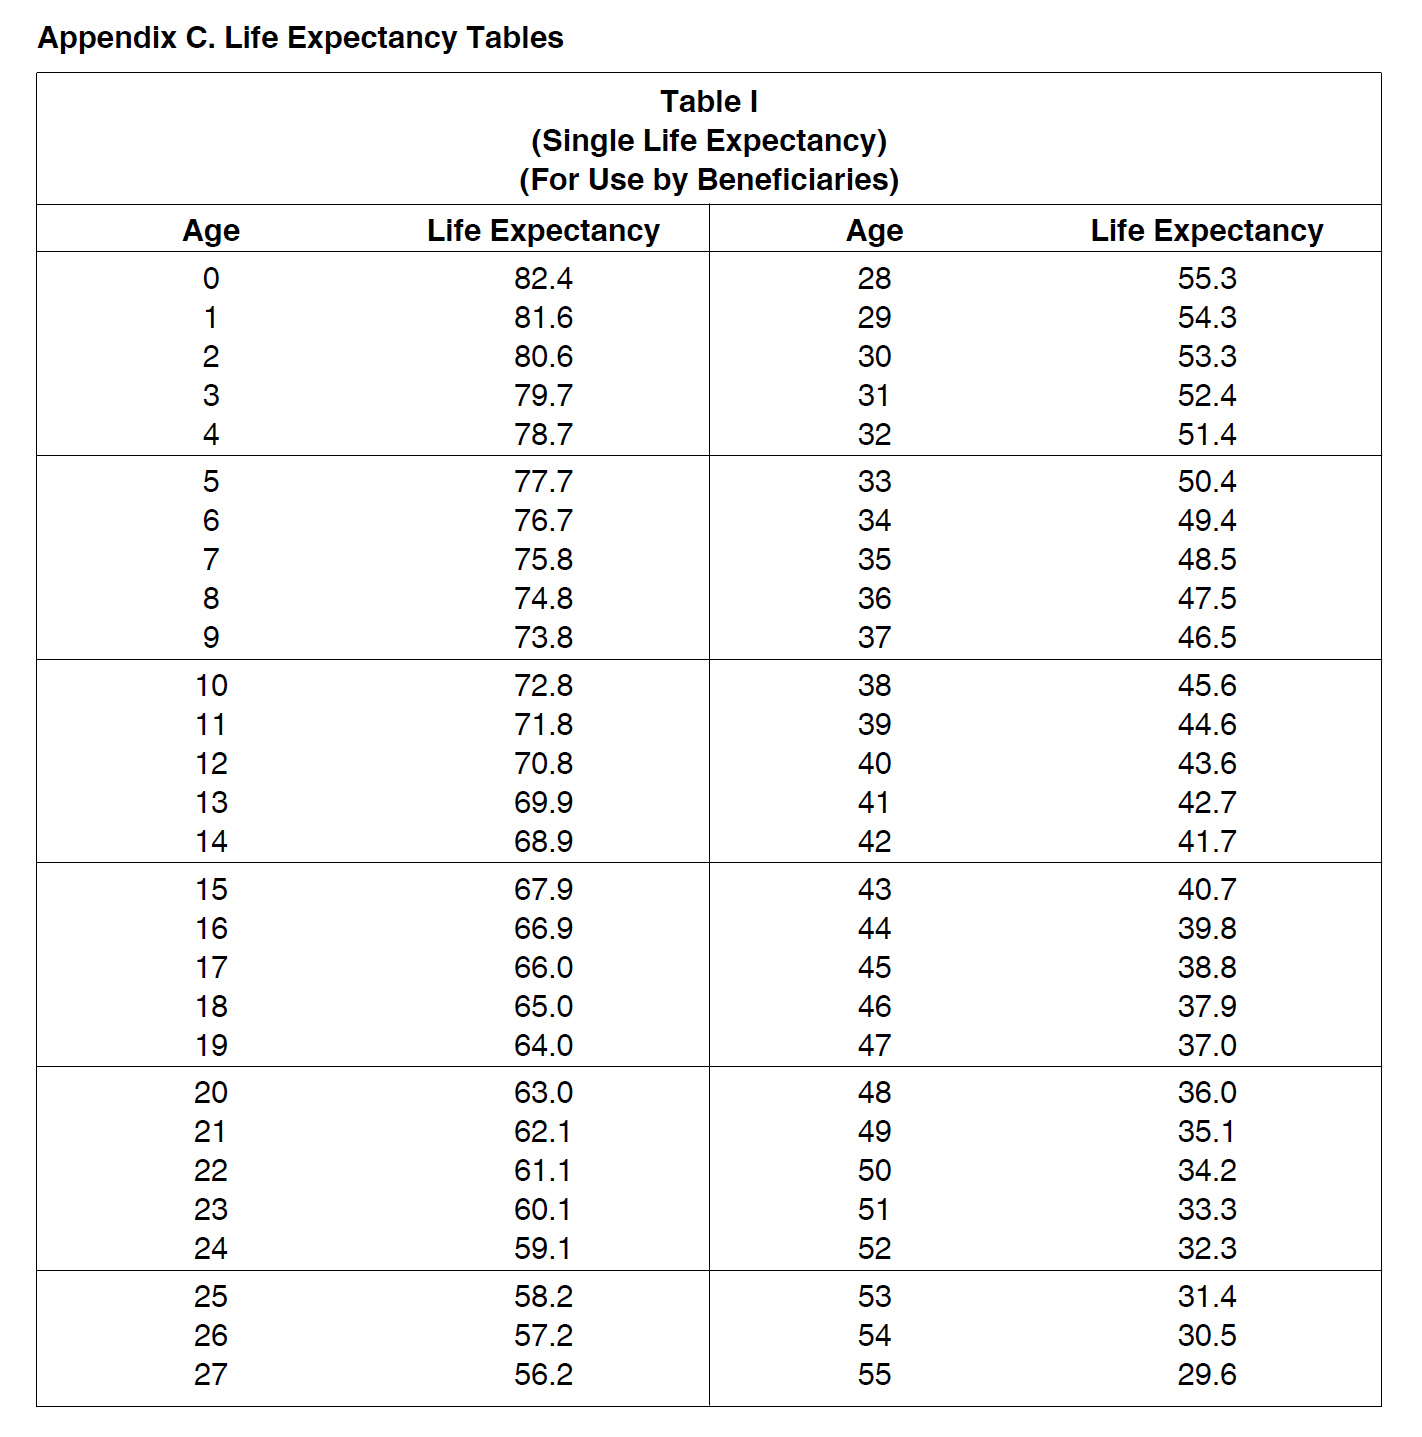
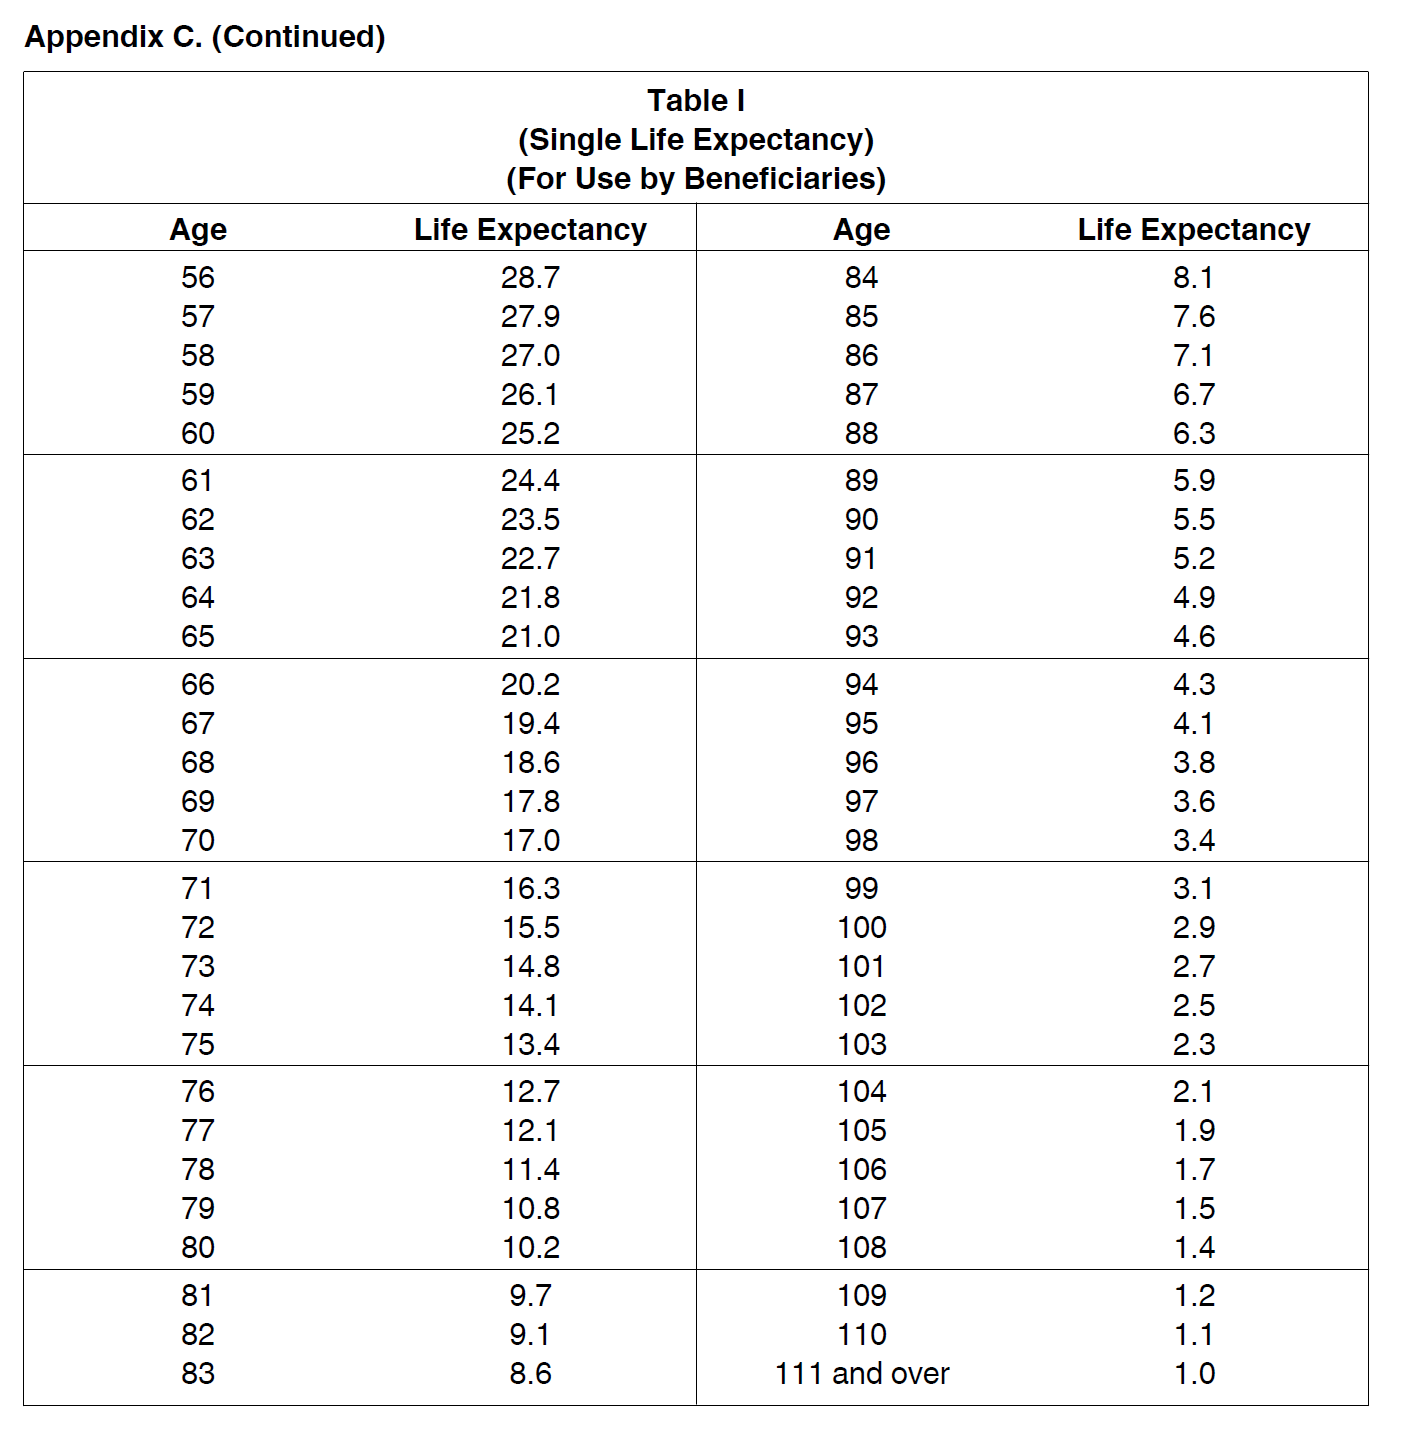


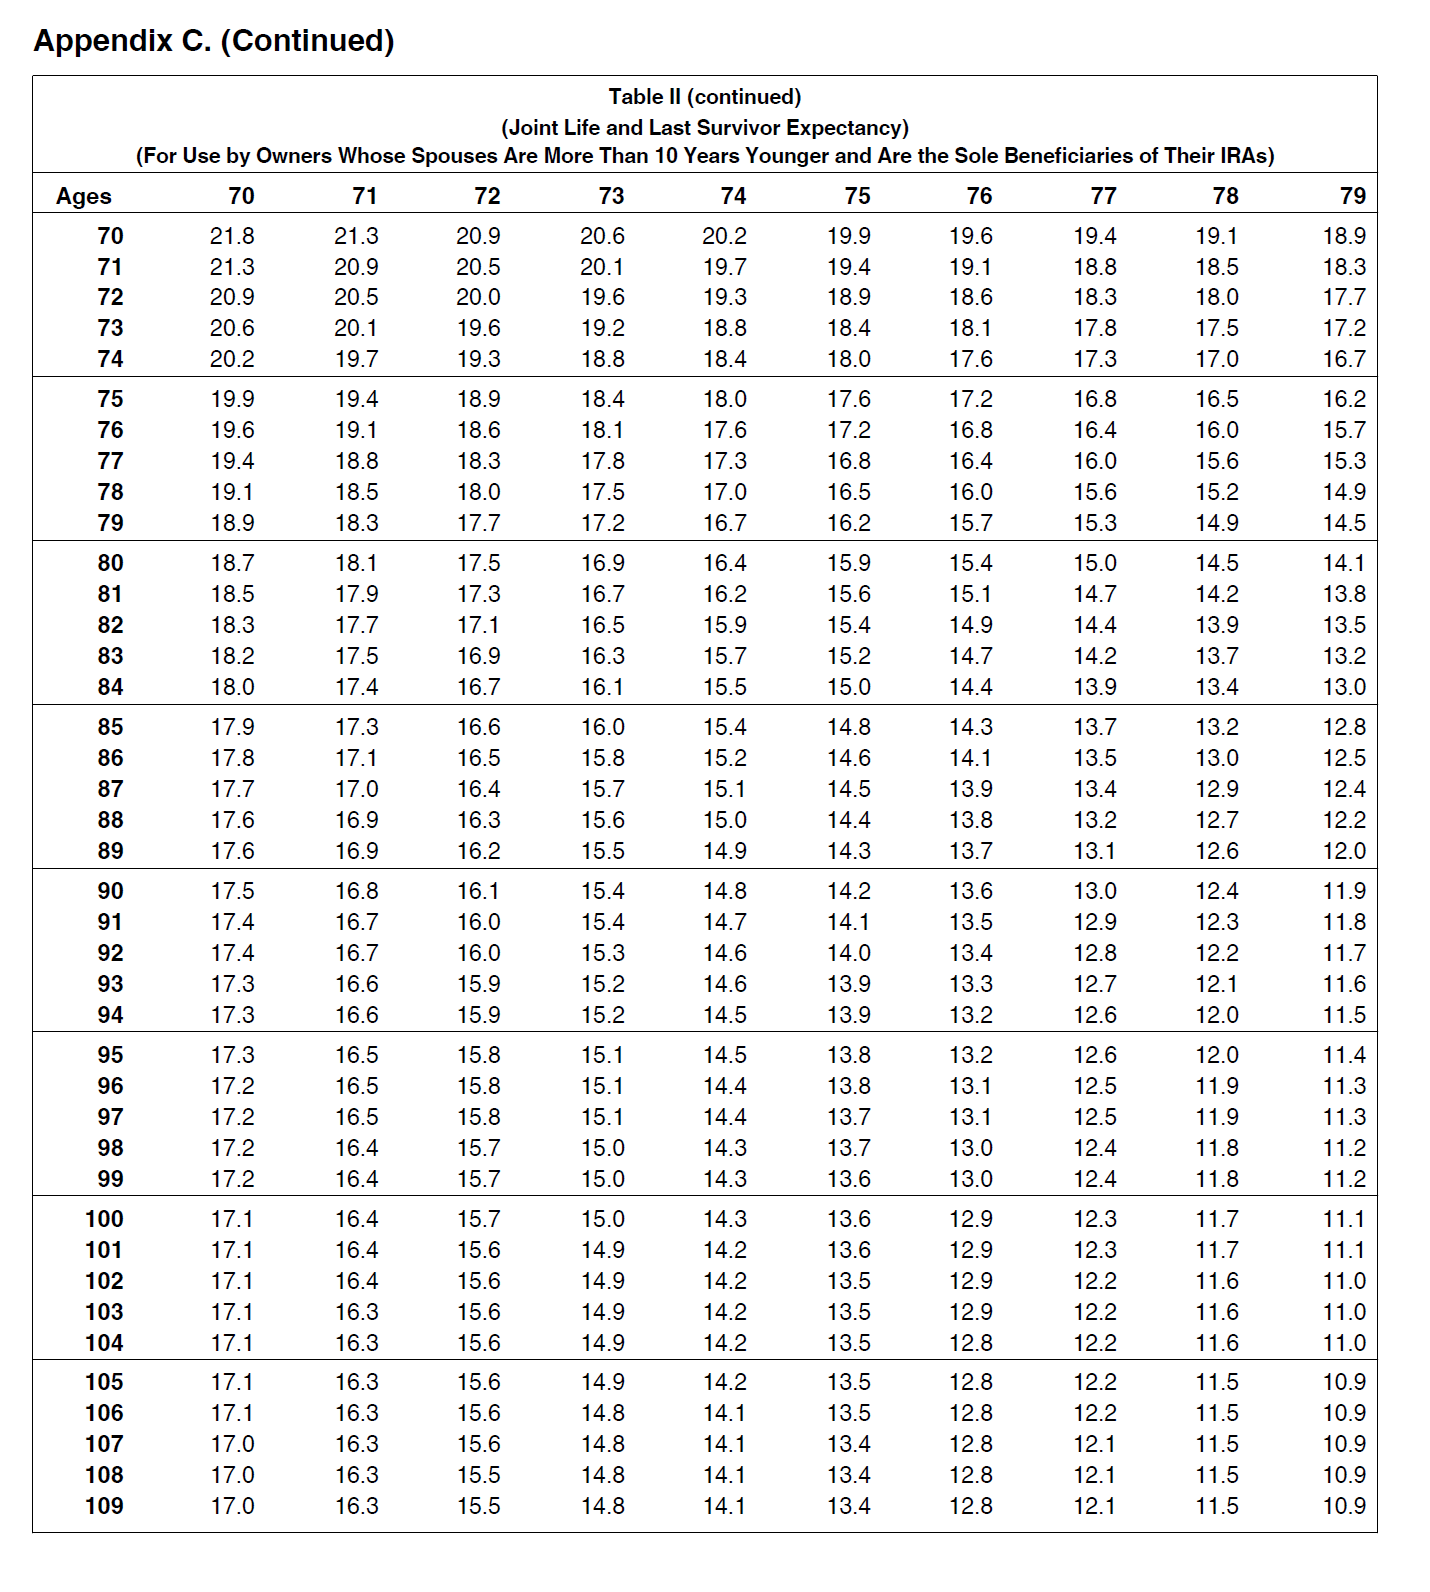

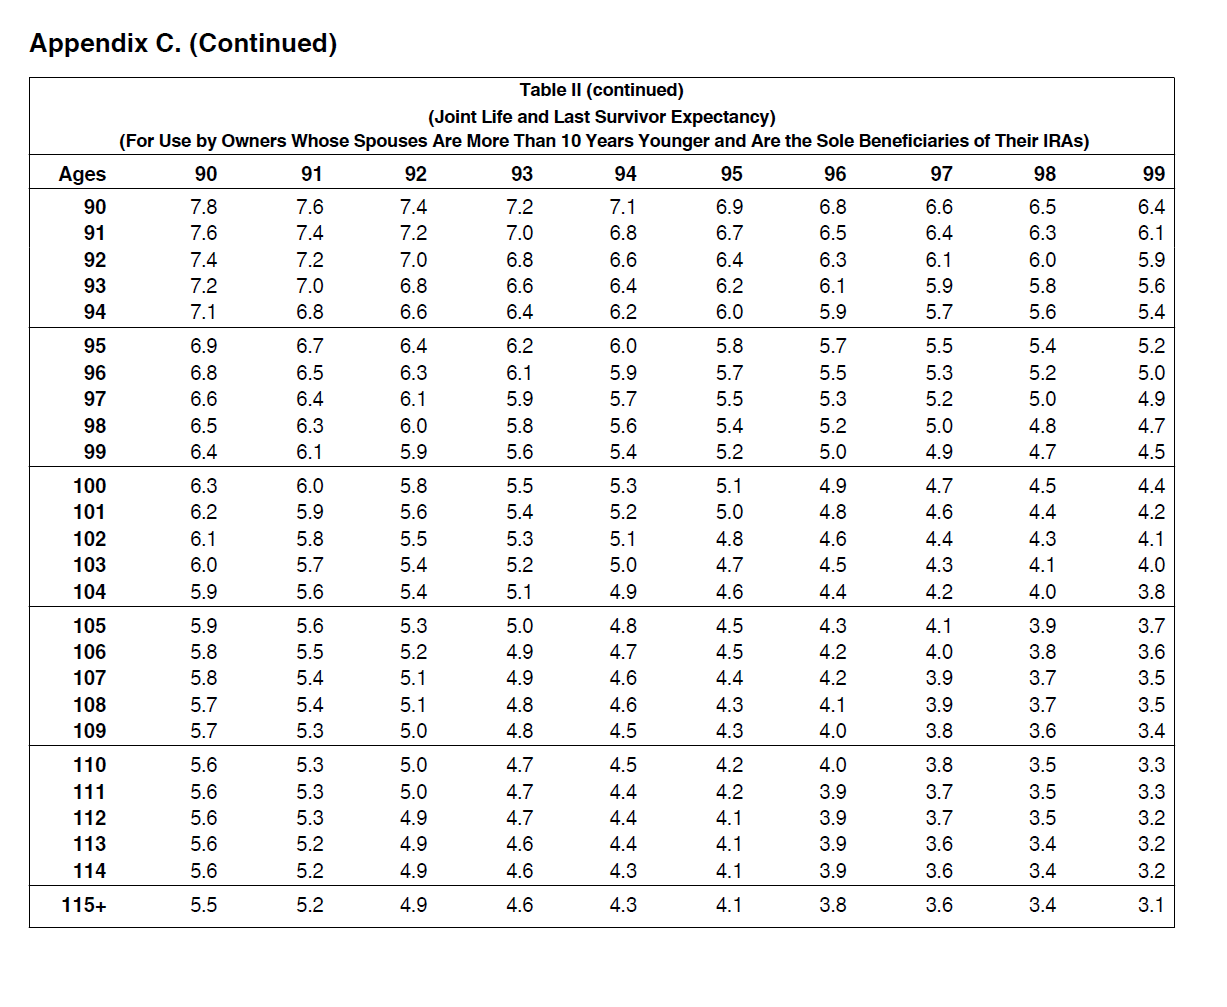


Appendix C. Life Expectancy Tables Table | (Single Life Expectancy) (For Use by Beneficiaries) Age Lite Expectancy Age Life Expectancy 0 82.4 28 55.3 1 81.6 29 54.3 2 80.6 30 53.3 3 79.7 31 52.4 4 78.7 32 51.4 5 77.7 33 50.4 6 76.7 34 49.4 7 75.8 35 48.5 8 74.8 36 47.5 9 73.8 37 46.5 10 72.8 38 45.6 11 71.8 39 44.6 12 70.8 40 43.6 13 69.9 41 42.7 14 68.9 42 41.7 15 67.9 43 40.7 16 66.9 44 39.8 17 66.0 45 38.8 18 65.0 46 37.9 19 64.0 47 37.0 20 63.0 48 36.0 21 62.1 49 35.1 22 61.1 50 34.2 23 60.1 51 33.3 24 59.1 52 32.3 25 58.2 53 31.4 26 57.2 54 30.5 27 56.2 55 29.6 Appendix C. (Continued) Table I (Single Life Expectancy) (For Use by Beneficiaries) Age Life Expectancy Age Life Expectancy 56 28.7 84 8.1 57 27.9 85 7.6 58 27.0 86 7.1 59 26.1 87 60 6.7 25.2 88 6.3 61 24.4 89 5.9 62 23.5 90 5.5 63 22.7 91 5.2 64 21.8 92 65 4.9 21.0 93 4.6 66 20.2 94 67 4.3 19.4 95 4.1 68 18.6 96 3.8 69 17.8 97 70 3.6 17.0 98 3.4 71 16.3 99 72 3.1 15.5 100 73 2.9 14.8 101 74 2.7 14.1 102 75 2.5 13.4 103 2.3 76 12.7 104 77 2.1 12.1 105 78 1.9 11.4 106 79 1.7 10.8 107 80 1.5 10.2 108 1.4 81 9.7 109 1.2 82 9.1 110 83 1.1 8.6 111 and over 1.0Appendix C. (Continued) Table II (continued) (Joint Life and Last Survivor Expectancy) (For Use by Owners Whose Spouses Are More Than 10 Years Younger and Are the Sole Beneficiaries of Their IRAs) 50 51 52 53 54 55 56 57 58 59 Ages 34.2 33.3 32.4 31.5 30.6 29.7 28.8 27.9 27.0 26.2 97 98 34.2 33.3 32.4 31.5 30.6 29.7 28.8 27.9 27.0 26.2 99 34.2 33.3 32.4 31.5 30.6 29.7 28.8 27.9 27.0 26.2 100 34.2 33.3 32.4 31.5 30.6 29.7 28.8 27.9 27.0 26.1 101 34.2 33.3 32.4 31.5 30.6 29.7 28.8 27.9 27.0 26.1 102 34.2 33.3 32.4 31.4 30.5 29.7 28.8 27.9 27.0 26.1 34.2 33.3 32.4 31.4 30.5 29.7 28.8 27.9 27.0 26.1 103 104 34.2 33.3 32.4 31.4 30.5 29.6 28.8 27.9 27.0 26.1 105 34.2 33.3 32.3 31.4 30.5 29.6 28.8 27.9 27.0 26.1 32.3 29.6 27.0 26.1 106 34.2 33.3 31.4 30.5 28.8 27.9 107 34.2 33.3 32.3 31.4 30.5 29.6 28.8 27.9 27.0 26.1 34.2 33.3 32.3 31.4 30.5 28.8 27.9 27.0 26.1 108 29.6 109 34.2 33.3 32.3 31.4 30.5 29.6 28.7 27.9 27.0 26.1 110 34.2 33.3 32.3 31.4 30.5 29.6 28.7 27.9 27.0 26.1 111 34.2 33.3 32.3 31.4 30.5 29.6 28.7 27.9 27.0 26.1 26.1 112 34.2 33.3 32.3 31.4 30.5 29.6 28.7 27.9 27.0 113 34.2 33.3 32.3 31.4 30.5 29.6 28.7 27.9 27.0 26.1 114 34.2 33.3 32.3 31.4 30.5 29.6 28.7 27.9 27.0 26.1 115+ 34.2 33.3 32.3 31.4 30.5 29.6 28.7 27.9 27.0 26.1 Table II (continued) (Joint Life and Last Survivor Expectancy) For Use by Owners Whose Spouses Are More Than 10 Years Younger and Are the Sole Beneficiaries of Their IRAs) Ages 60 61 62 53 64 65 66 67 68 59 60 30.9 30.4 30.0 29.6 29.2 28.8 28.5 28.2 27.9 27.6 61 30.4 29.9 29.5 29.0 28.6 28.3 27.9 27.6 27.3 27.0 26.4 62 30.0 29.5 29.0 28.5 28.1 27.7 27.3 27.0 26.7 63 29.6 29.0 28.5 28.1 27.6 27.2 26.8 26.4 26.1 25.7 64 29.2 28.6 28.1 27.6 27.1 26.7 26.3 25.9 25.5 25.2 65 28.8 28.3 27.7 27.2 26.7 26.2 25.8 25.4 25.0 24.6 66 28.5 27.9 27.3 26.8 26.3 25.8 25.3 24.9 24.5 24.1 67 28.2 27.6 27.0 26.4 25.9 25.4 24.9 24.4 24.0 23.6 68 27.9 27.3 26.7 26.1 25.5 25.0 24.5 24.0 23.5 23.1 69 27.6 27.0 26.4 25.7 25.2 24.6 24.1 23.6 23.1 22.6 70 27.4 26.7 26.1 25.4 24.8 24.3 23.7 23.2 22.7 22.2 71 27.2 26.5 25.8 25.2 24.5 23.9 23.4 22.8 22.3 21.8 72 27.0 26.3 25.6 24.9 24.3 23.7 23.1 22.5 22.0 21.4 73 26.8 26.1 25.4 24.7 24.0 23.4 22.8 22.2 21.6 21.1 74 26.6 25.9 25.2 24.5 23.8 23.1 22.5 21.9 21.3 20.8 75 25.7 25.0 24.3 23.6 22.9 22.3 21.6 21.0 20.5 26.5Appendix C. (Continued) Table II (continued) (Joint Life and Last Survivor Expectancy) (For Use by Owners Whose Spouses Are More Than 10 Years Younger and Are the Sole Beneficiaries of Their IRAs) Ages 60 61 62 63 64 65 66 67 68 69 76 26.3 25.6 24.8 24.1 23.4 22.7 22.0 21.4 20.8 20.2 77 26.2 25.4 24.7 23.9 23.2 22.5 21.8 21.2 20.6 19.9 78 26.1 25.3 24.6 23.8 23.1 22.4 21.7 21.0 20.3 19.7 79 26 0 25.2 24.4 23.7 22.9 22.2 21.5 20 8 20 1 19.5 BO 25.9 25.1 24.3 23.6 22.8 22.1 21.3 20.6 20.0 19.3 81 25.8 25.0 24.2 23.4 22.7 21.9 21.2 20.5 19.8 19.1 82 25.8 24.9 24.1 23.4 22.6 21.8 21.1 20.4 19.7 19.0 83 25.7 24.9 24.1 23.3 22.5 21.7 21.0 20.2 19.5 18.8 84 25.6 24.8 24.0 23.2 22.4 21.6 20.9 20.1 19.4 18.7 85 25.6 24.8 23.9 23.1 22.3 21.6 20.8 20.1 19.3 18.6 86 25.5 24.7 23.9 23.1 22.3 21.5 20.7 20.0 19.2 18.5 37 25.5 24.7 23.8 23.0 22.2 21.4 20.7 19.9 19.2 18.4 38 25.5 24.6 23.8 23.0 22.2 21.4 20.6 19.8 19.1 18.3 39 25.4 24.6 23.8 22.9 22.1 21.3 20.5 19.8 19.0 18.3 90 25.4 24.6 23.7 22.9 22.1 21.3 20.5 19.7 19.0 18.2 91 25.4 24.5 23.7 22.9 22.1 21.3 20.5 19.7 18.9 18.2 92 25.4 24.5 23.7 22.9 22.0 21.2 20.4 19.6 18.9 18.1 93 25.4 24.5 23.7 22.8 22.0 21.2 20.4 19.6 18.8 18.1 94 25.3 24.5 23.6 22.8 22.0 21.2 20.4 19.6 18.8 18.0 95 25.3 24.5 23.6 22.8 22.0 21. 20.3 19.6 18.8 18.0 96 25.3 24.5 23.6 22.8 21.9 21.1 20.3 19.5 18.8 18.0 97 25.3 24.5 23.6 22.8 21.9 21.1 20.3 19.5 18.7 18.0 98 25.3 24.4 23.6 22.8 21.9 21.1 20.3 19.5 18.7 17.9 99 25.3 24.4 23.6 22.7 21.9 21.1 20.3 19.5 18.7 17.9 100 25.3 24.4 23.6 22.7 21.9 21.1 20.3 19.5 18.7 17.9 101 25.3 24.4 23.6 22.7 21.9 21.1 20.2 19.4 18.7 17.9 102 25.3 24.4 23.6 22.7 21.9 21.1 20.2 19.4 18.6 17.9 103 25.3 24.4 23.6 22.7 21.9 21.0 20.2 19.4 18.6 17.9 104 25.3 24.4 23.5 22.7 21.9 21.0 20.2 19.4 18.6 17.8 105 25.3 24.4 23.5 22.7 21.9 21.0 20.2 19.4 18.6 17.8 106 25.3 24.4 23.5 22.7 21.9 21.0 20.2 19.4 18.6 17.8 107 25.2 24.4 23.5 22.7 21.8 21.0 20.2 19.4 18.6 17.8 108 25.2 24.4 23.5 22.7 21.8 21.0 20.2 19.4 18.6 17.8 109 25.2 24.4 23.5 22.7 21.8 21.0 20.2 19.4 18.6 17.8 110 25.2 24.4 23.5 22.7 21.8 21.0 20.2 19.4 18.6 17.8 111 25.2 24.4 23.5 22.7 21.8 21.0 20.2 19.4 18.6 17.8 112 25.2 24.4 23.5 22.7 21.8 21.0 20.2 19.4 18.6 17.8 113 25.2 24.4 23.5 22.7 21.8 21.0 20.2 19.4 18.6 17.8 114 25.2 24.4 23.5 22.7 21.8 21.0 20.2 19.4 18.6 17.8 115+ 25.2 24.4 23.5 22.7 21.8 21.0 20.2 19.4 18.6 17.8Appendix C. (Continued) Table II (continued) (Joint Life and Last Survivor Expectancy) (For Use by Owners Whose Spouses Are More Than 10 Years Younger and Are the Sole Beneficiaries of Their IRAs) Ages 70 71 72 73 74 75 76 77 78 79 70 21.8 21.3 20.9 20.6 20.2 19.9 21.3 19.6 71 20.9 20.5 19.4 19.1 20.1 19.7 18.9 72 19.4 20.9 19.1 20.5 18.8 18.5 20.0 19.6 18.3 19.3 73 18.9 20.6 18.6 18.3 20.1 19.6 19.2 18.0 17.7 18.8 18.4 74 20.2 18.1 19.7 19.3 17.8 18.8 17.5 18.4 17.2 18.0 17.6 17.3 17.0 75 16.7 19.9 19.4 18.9 18.4 18.0 76 17.6 19.6 17.2 19.1 16.8 18.6 18.1 16.5 17.6 16.2 77 17.2 16.8 19.4 16.4 18.8 18.3 16.0 17.8 15.7 17.3 78 16.8 16.4 19.1 16.0 18.5 15.6 18.0 17.5 15.3 17.0 79 16.5 16.0 18.9 15.6 18.3 15.2 17.7 14.9 17.2 16.7 16.2 15.7 15.3 14.9 80 14.5 18.7 18.1 17.5 16.9 16.4 81 15.9 15.4 18.5 17.9 15.0 14.5 17.3 14.1 16.7 82 16.2 15.6 15.1 18.3 17.7 14.7 17.1 14.2 16.5 13.8 83 15.9 15.4 14.9 18.2 17.5 14.4 16.9 13.9 84 16.3 13.5 15.7 15.2 18.0 14.7 17.4 16.7 14.2 16.1 13.7 15.5 13.2 15.0 14.4 13.9 13.4 13.0 35 17.9 17.3 16.6 16.0 15.4 14.8 14.3 36 17.8 13.7 17.1 16.5 13.2 15.8 12.8 15.2 14.6 87 14.1 17.7 17.0 13.5 16.4 13.0 15.7 12.5 15.1 14.5 38 13.9 17.6 16.9 13.4 16.3 12.9 15.6 12.4 15.0 14.4 89 13.8 17.6 16.9 16.2 13.2 12.7 15.5 14.9 12.2 14.3 13.7 13.1 12.6 90 12.0 17.5 16.8 16.1 15.4 14.8 91 14.2 17.4 13.6 16.7 13.0 16.0 15.4 12.4 11.9 14.7 14.1 92 17.4 13.5 12.9 16.7 16.0 15.3 12.3 11.8 14.6 93 14.0 13.4 17.3 12.8 16.6 15.9 12.2 15.2 11.7 14.6 94 13.9 13.3 17.3 16.6 12.7 15.9 12.1 15.2 11.6 14.5 13.9 13.2 12.6 12.0 11.5 95 17.3 16.5 15.8 15.1 14.5 13.8 96 13.2 17.2 16.5 15.8 12.6 12.0 15.1 11.4 14.4 13.8 97 13.1 17.2 12.5 16.5 15.8 11.9 15.1 11.3 14.4 13.7 13.1 98 17.2 16.4 15.7 12.5 11.9 15.0 11.3 14.3 99 13.7 17.2 13.0 16.4 15.7 12.4 11.8 15.0 11.2 14.3 13.6 13.0 12.4 11.8 11.2 100 17.1 16.4 15.7 15.0 14.3 13.6 101 12.9 17.1 16.4 12.3 11.7 15.6 14.9 11.1 14.2 13.6 102 12.9 17.1 16.4 12.3 15.6 11.7 14.9 11.1 14.2 13.5 103 12.9 17.1 16.3 15.6 12.2 11.6 14.9 14.2 11.0 104 13.5 17.1 12.9 16.3 15.6 12.2 14.9 11.6 14.2 11.0 13.5 12.8 12.2 11.6 105 11.0 17.1 16.3 15.6 14.9 14.2 13.5 106 12.8 17.1 16.3 12.2 15.6 11.5 10.9 14.8 14.1 107 13.5 17.0 12.8 16.3 12.2 15.6 11.5 10.9 14.8 14.1 108 17.0 13.4 12.8 16.3 12.1 15.5 11.5 10.9 14.8 14.1 109 13.4 17.0 12.8 16.3 12.1 15.5 11.5 14.8 10.9 14.1 13.4 12.8 12.1 11.5 10.9Appendix C. (Continued) Table II (continued) (Joint Life and Last Survivor Expectancy) (For Use by Owners Whose Spouses Are More Than 10 Years Younger and Are the Sole Beneficiaries of Their IRAs) Ages 70 71 72 73 74 75 76 77 78 79 110 17.0 16.3 15.5 14.8 14.1 13.4 12.7 12.1 11.5 10.9 111 17.0 16.3 15.5 14.8 14.1 13.4 12.7 12.1 11.5 10.8 112 17.0 16.3 15.5 14.8 14.1 13.4 12.7 12.1 11.5 10.8 113 17.0 16.3 15.5 14.8 14.1 13.4 12.7 12.1 11.4 10.8 114 17.0 16.3 15.5 14.8 14.1 13.4 12.7 12.1 11.4 10.8 115+ 17.0 16.3 15.5 14.8 14.1 13.4 12.7 12.1 11.4 10.8 Table II (conti (Joint Life and Last Survivor Expectancy) (For Use by Owners Whose Spouses Are More Than 10 Years Younger and Are the Sole Beneficiaries of Their IRAs) Ages 80 81 82 83 84 85 86 87 88 89 80 13.8 13.4 13.1 12.8 12.6 12.3 12.1 11.9 11.7 11.5 81 13.4 13.1 12.7 12.4 12.2 11.9 11.7 11.4 11.3 11.1 82 13.1 12.7 12.4 12.1 11.8 11.5 11.3 11.0 10.8 10.6 83 12.8 12.4 12.1 11.7 11.4 11.1 10.9 10.6 10.4 10.2 84 12.6 12.2 11.8 11.4 11.1 10.8 10.5 10.3 10.1 9.9 85 12.3 11.9 11.5 11.1 10.8 10.5 10.2 9.9 9.7 9.5 86 12.1 11.7 11.3 10.9 10.5 10.2 9.9 9.6 9.4 9.2 87 11.9 11.4 11.0 10.6 10.3 9.9 9.6 9.4 9.1 8.9 88 11.7 11.3 10.8 10.4 10.1 9.7 9.4 9.1 8.8 8.6 39 11.5 11.1 10.6 10.2 9 9 9.5 9.2 8.9 8.6 8.3 90 11.4 10.9 10.5 10.1 9.7 9.3 9.0 8.6 8.3 8.1 91 11.3 10.8 10.3 9.9 9.5 9.1 8.8 8.4 8.1 7.9 92 11.2 10.7 10.2 9 .8 9.3 9.0 8.6 8.3 8.0 7.7 93 11.1 10.6 10.1 9.6 9.2 8.8 8.5 8.1 7.8 7.5 94 11.0 10.5 10.0 9.5 9 .1 8.7 8.3 8.0 7.6 7.3 95 10.9 10.4 9.9 9.4 9.0 8.6 8.2 7.8 7.5 7.2 96 10.8 10.3 9.8 9.3 8.9 85 8.1 7.7 7.4 7.1 97 10.7 10.2 9.7 9.2 8.8 8.4 8.0 7.6 7.3 6.9 98 10.7 10.1 9.6 9.2 8.7 8.3 7.9 7.5 7.1 6.8 99 10.6 10.1 9.6 9.1 8.6 8.2 7.8 7.4 7.0 6.7 100 10.6 10.0 9.5 9.0 8.5 8.1 7.7 7.3 6.9 6.6 101 10.5 10.0 9.4 9.0 8.5 8.0 7.6 7.2 6.9 6.5 102 10.5 9.9 9.4 8.9 8.4 8.0 7.5 7.1 6.8 6.4 103 10.4 9.9 9.4 8.8 8.4 7.9 7.5 7.1 6.7 6.3 104 10.4 9.8 9.3 8.8 8.3 7.9 7.4 7.0 6.6 6.3 105 10.4 9.8 9.3 8.8 8.3 7.8 7.4 7.0 6.6 6.2 106 10.3 9.8 9.2 8.7 8.2 7.8 7.3 6.9 6.5 6.2 107 10.3 9.8 9.2 8.7 8.2 7.7 7.3 6.9 6.5 6.1 108 10.3 9.7 9.2 8.7 8.2 7.7 7.3 6.8 6.4 6.1 109 10.3 9.7 9.2 8.7 8.2 7.7 7.2 6.8 6.4 6.0 110 10.3 9.7 9.2 8.6 8.1 7.7 7.2 6.8 6.4 6.0 111 10.3 9.7 9.1 8.6 8.1 7.6 7.2 6.8 6.3 6.0 112 10.2 9.7 9.1 8.6 8.1 7.6 7.2 6.7 6.3 5.9 113 10.2 9.7 9.1 8.6 8.1 7.6 7.2 6.7 6.3 5.9 114 10.2 9.7 9.1 8.6 8.1 7.6 7.1 6.7 63 5.9 115+ 10.2 9.7 9.1 8.6 8.1 7.6 7.1 67 63 5.9 Page 106 Publication 590 (2012)Appendix C. (Continued) Table II (continued) (Joint Life and Last Survivor Expectancy) For Use by Owners Whose Spouses Are More Than 10 Years Younger and Are the Sole Beneficiaries of Their IRAs) Ages 90 91 92 93 94 95 96 97 98 99 90 7.8 7.6 7.4 7.2 7.1 6.9 6.8 6.6 6.5 6.4 91 7.6 7.4 7.2 7.0 6.8 6.7 6.5 6.4 6.3 6.1 92 7.4 7.2 7.0 6.8 6.6 6.4 6.3 6.1 6.0 5.9 93 7.2 7.0 6.8 6.6 6.4 6.2 6.1 5.9 5.8 5.6 94 7.1 6.8 6.6 6.4 6.2 6.0 5.9 5.7 5.6 5.4 95 6.9 6.7 6.4 6.2 6.0 5.8 5.7 5.5 5.4 5.2 96 6.8 6.5 6.3 6.1 5.9 5.7 5.5 5.3 5.2 5.0 97 6.6 6.4 6.1 5.9 5.7 5.5 5.3 5.2 5.0 4.9 98 6.5 6.3 6.0 5.8 5.6 5.4 5.2 5.0 4.8 4.7 99 6.4 61 5.9 5.6 54 52 5.0 19 47 45 100 6.3 6.0 5.8 5.5 5.3 5.1 4.9 4.7 4.5 4.4 101 6.2 5.9 5.6 5.4 5.2 5.0 4.8 4.6 4.4 42 102 6.1 5.8 5.5 5.3 5.1 4.8 4.6 4.4 4.3 4.1 103 6.0 5.7 5.4 5.2 5.0 47 4.5 43 4.1 4.0 104 5.9 5.6 5.4 5.1 4.9 4.6 4.4 4.2 4.0 3.8 105 5.9 5.6 5.3 5.0 4.8 4.5 4.3 4. 1 3.9 3.7 106 58 5.5 5.2 4.9 4.7 45 4.2 4.0 3.8 3.6 107 5.8 5.4 5.1 4.9 4.6 4.4 4.2 3.9 3.7 3.5 108 5.7 5.4 5.1 4.8 4.6 4.3 4.1 3.9 3.7 3.5 109 5.7 5.3 5.0 48 4.5 43 4.0 3.8 3.6 3.4 110 5.6 5.3 5.0 4.7 4.5 4.2 4.0 3.8 3.5 3.3 111 5.6 5.3 5.0 47 4.4 4.2 3.9 3.7 3.5 3.3 112 5.6 5.3 4.9 4.7 4.4 41 3.9 3.7 3.5 3.2 113 5.6 5.2 4.9 4.6 4.4 4.1 3.9 3.6 3.4 3.2 114 5.6 5.2 4.9 4.6 4.3 41 3.9 36 3.4 3.2 115+ 5.5 5.2 4.9 4.6 4.3 4.1 3.8 3.6 3.4 3.1Appendix C. (Continued) Table II (continued) (Joint Life and Last Survivor Expectancy) (For Use by Owners Whose Spouses Are More Than 10 Years Younger and Are the Sole Beneficiaries of Their IRAs) Ages 100 101 102 103 104 105 106 107 100 108 109 4.2 4.1 3.9 3.8 101 3.7 4.1 3.5 3.9 3.4 3.7 3.3 3.6 3.3 3.5 3.2 102 3.4 3.9 3.2 3.7 3.1 3.1 3.6 3.4 3.0 3.3 103 3.2 3.8 3.6 3.1 3.0 3.4 2.9 3.3 2.8 104 3.2 3.7 3.0 3.5 2.9 3.3 2.8 2.7 3.2 3.0 2.6 2.9 2.7 105 2.6 2.5 3.5 3.4 2.4 3.2 3.0 2.9 106 2.7 3.4 2.6 3.2 2.5 3.1 2.4 2.9 2.3 2.7 107 3.3 2.6 3.1 2.4 2.3 3.0 2.8 2.2 2.6 2.1 2.5 108 2.3 3.3 3.1 2.2 2.1 2.9 2.7 2.0 109 2.5 2.4 3.2 2.2 3.0 2.8 2.1 2.6 1.9 2.4 1.8 2.3 2.1 2.0 1.8 110 1.7 3.1 2.9 2.7 2.5 111 2.3 3.1 2.2 2.9 2.0 2.7 1.9 1.7 2.5 2.3 1.6 2.1 112 3.0 1.9 2.8 1.8 2.6 1.6 2.4 1.5 113 2.2 2.0 3.0 2.8 1.9 2.6 1.7 1.5 2.4 1.4 114 2.2 2.0 3.0 2.7 1.8 1.6 2.5 1.5 2.3 1.3 2.1 1.9 1.8 1.6 115+ 1.4 1.3 2.9 2.7 2.5 2.3 2.1 1.9 1.7 1.5 1.4 1.2 Table II (continued) (Joint Life and Last Survivor Expectancy) (For Use by Owners Whose Spouses Are More Than 10 Years Younger and Are the Sole Beneficiaries of Their IRAs) Ages 110 111 112 113 114 115+ 110 1.5 1.4 1.3 1.2 111 1.1 1.1 1.4 1.2 1.1 1.1 112 1.0 1.3 1.0 1.1 1.0 1.0 1.0 113 1.0 1.2 1.1 1.0 1.0 1.0 114 1.0 1.1 1.0 1.0 1.0 1.0 1.0 115+ 1.1 1.0 1.0 1.0 1.0 1.0Appendix C. Uniform Lifetime Table Table III (Uniform Lifetime) (For Use by: 0 Unmarried Owners, 0 Married Owners Whose Spouses Are Not More Than 10 Years Younger, and 0 Married Owners Whose Spouses Are Not the Sole Beneficiaries of Their IRAs) Age Distribution Period Age Distribution Period 70 27.4 93 9.6 71 26.5 94 9.1 72 25.6 95 8.6 73 24.7 96 8.1 74 23.8 97 7.6 75 22.9 98 7.1 76 22.0 99 6.7 77 21.2 100 6.3 78 20.3 101 5.9 79 19.5 102 5.5 80 18.7 103 5.2 81 17.9 104 4.9 82 17.1 105 4.5 83 16.3 106 4.2 84 15.5 107 3.9 85 14.8 108 3.7 86 14.1 109 3.4 87 13.4 110 3.1 88 12.7 111 2.9 89 12.0 112 2.6 90 11.4 113 2.4 91 10.8 114 2.1 92 10.2 115 and over 1.9
Step by Step Solution
There are 3 Steps involved in it

Get step-by-step solutions from verified subject matter experts