

Question: 2. The following data was recorded for a manufacturing process. The data was recorded in the table below. To properly analyze the data, we
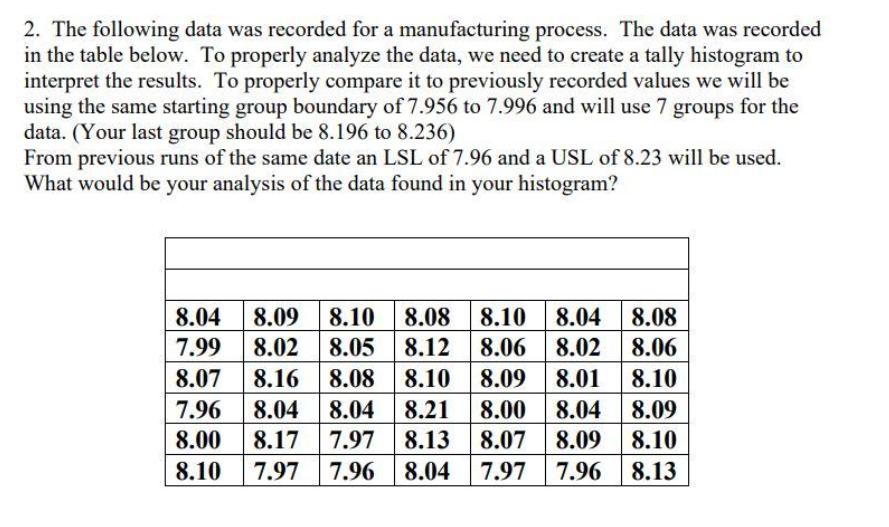
2. The following data was recorded for a manufacturing process. The data was recorded in the table below. To properly analyze the data, we need to create a tally histogram to interpret the results. To properly compare it to previously recorded values we will be using the same starting group boundary of 7.956 to 7.996 and will use 7 groups for the data. (Your last group should be 8.196 to 8.236) From previous runs of the same date an LSL of 7.96 and a USL of 8.23 will be used. What would be your analysis of the data found in your histogram? 8.04 8.08 7.99 8.09 8.10 8.08 8.10 8.04 8.02 8.05 8.12 8.06 8.02 8.06 8.10 8.07 8.16 8.08 8.10 8.09 8.01 7.96 8.04 8.04 8.21 8.00 8.04 8.09 8.00 8.17 7.97 8.13 8.07 8.07 8.09 8.10 8.10 7.97 7.96 8.04 7.97 7.96 8.13
Step by Step Solution
3.46 Rating (149 Votes )
There are 3 Steps involved in it
By using R software xc804799809810808810804808802805812806802... View full answer

Get step-by-step solutions from verified subject matter experts