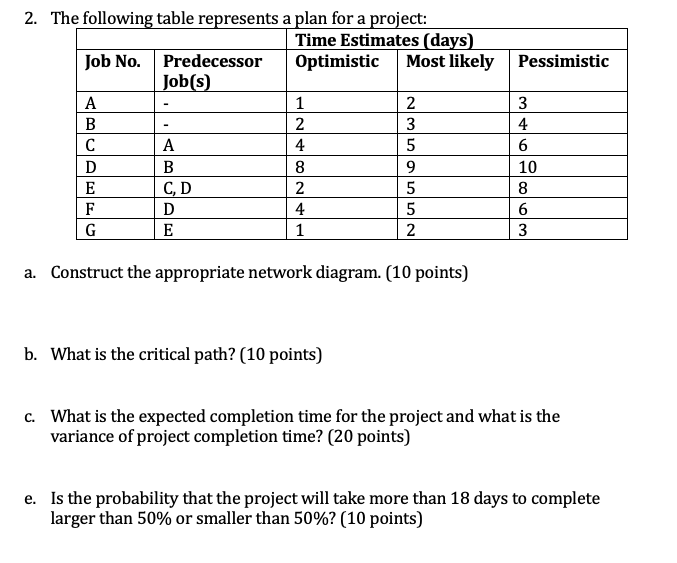
Question: 2. The following table represents a plan for a project: Time Estimates (days) Job No. Predecessor Optimistic Most likely Pessimistic Job(s) A 1 2 3

2. The following table represents a plan for a

2. The following table represents a plan for a project: Time Estimates (days) Job No. Predecessor Optimistic Most likely Pessimistic Job(s) A 1 2 3 B 2 3 4 A 4 5 6 D B 8 9 10 E CD 2 5 8 F D 4 5 6 G E 1 2 3 a. Construct the appropriate network diagram. (10 points) b. What is the critical path? (10 points) c. What is the expected completion time for the project and what is the variance of project completion time? (20 points) e. Is the probability that the project will take more than 18 days to complete larger than 50% or smaller than 50%? (10 points)

Step by Step Solution

There are 3 Steps involved in it

1 Expert Approved Answer
Step: 1 Unlock blur-text-image
Question Has Been Solved by an Expert!

Get step-by-step solutions from verified subject matter experts

Step: 2 Unlock
Step: 3 Unlock

Students Have Also Explored These Related General Management Questions!