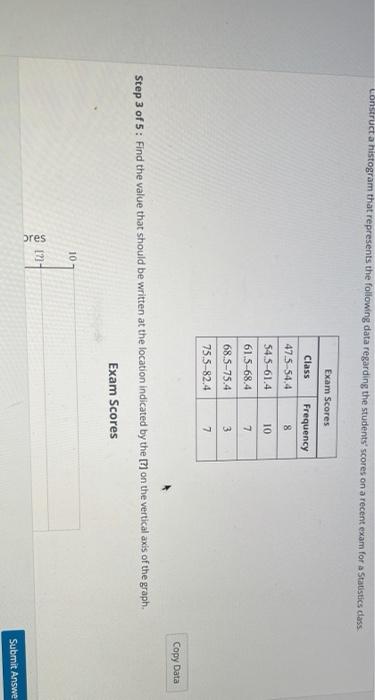
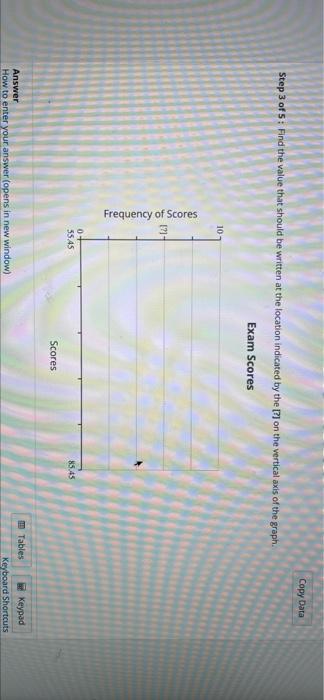
Question: construct a histogram that represents the following data regarding the students scores on a recent exam for a Statistics class Exam Scores Class Frequency 8

construct a histogram that represents the
construct a histogram that represents the following data regarding the students scores on a recent exam for a Statistics class Exam Scores Class Frequency 8 47.5-54.4 54.5-61.4 10 61.5-68.4 7 68.5-75.4 3 75.5-82.4 7 Copy Data Step 3 of 5: Find the value that should be written at the location indicated by the l on the vertical axis of the graph, Exam Scores 10- bres 1 Submit Answe Copy Data Step 3 of 5: Find the value that should be written at the location indicated by the [?] on the vertical axis of the graph Exam Scores 10 Frequency of Scores 0 5545 85.45 Scores Answer How to enter your answer (opens in new window) Tables Keypad Keyboard Shortcuts

Step by Step Solution

There are 3 Steps involved in it

1 Expert Approved Answer
Step: 1 Unlock blur-text-image
Question Has Been Solved by an Expert!

Get step-by-step solutions from verified subject matter experts

Step: 2 Unlock
Step: 3 Unlock

Students Have Also Explored These Related General Management Questions!