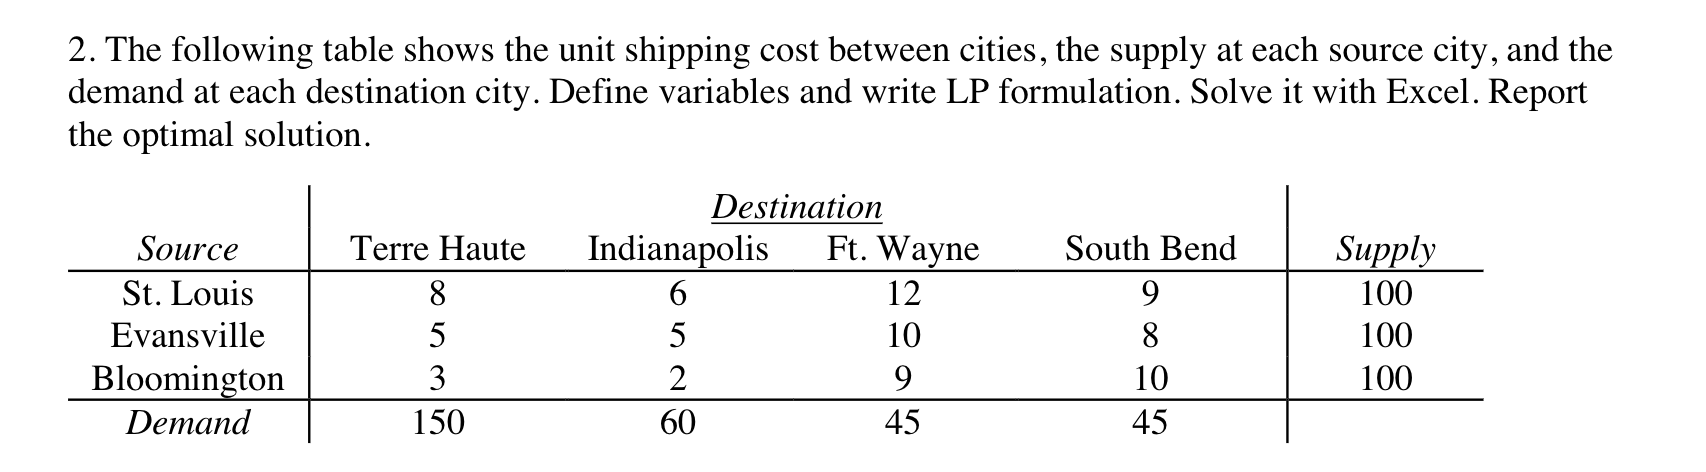
Question: 2. The following table shows the unit shipping cost between cities, the supply at each source city, and the demand at each destination city. Define

2. The following table shows the unit shipping

2. The following table shows the unit shipping cost between cities, the supply at each source city, and the demand at each destination city. Define variables and write LP formulation. Solve it with Excel. Report the optimal solution. Source St. Louis Evansville Bloomington Demand Terre Haute 8 5 3 150 Destination Indianapolis Ft. Wayne 6 12 5 10 2 9 60 45 South Bend 9 8 10 45 Supply 100 100 100

Step by Step Solution

There are 3 Steps involved in it

1 Expert Approved Answer
Step: 1 Unlock blur-text-image
Question Has Been Solved by an Expert!

Get step-by-step solutions from verified subject matter experts

Step: 2 Unlock
Step: 3 Unlock

Students Have Also Explored These Related General Management Questions!