

Question: 2. The graph below shows Brooklin's distance from home. Distance (km) vs. Time (h) . Distance (km) - -65.8*x + 265 RX = 0.93 250

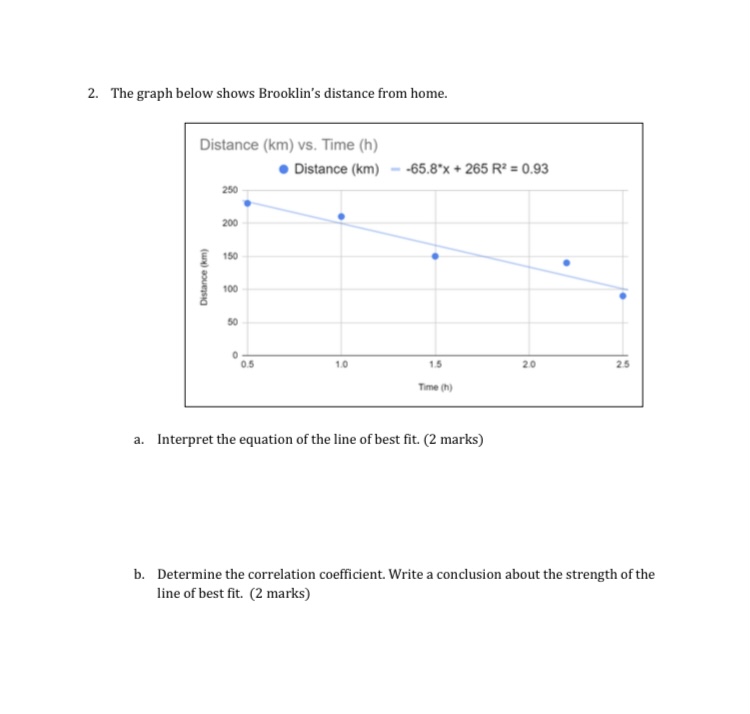
2. The graph below shows Brooklin's distance from home. Distance (km) vs. Time (h) . Distance (km) - -65.8*x + 265 RX = 0.93 250 200 150 Distance (kum 0 0.5 1.0 1.5 20 25 Time (h) a. Interpret the equation of the line of best fit. (2 marks) b. Determine the correlation coefficient. Write a conclusion about the strength of the line of best fit. (2 marks)
Step by Step Solution
There are 3 Steps involved in it
1 Expert Approved Answer
Step: 1 Unlock

Question Has Been Solved by an Expert!
Get step-by-step solutions from verified subject matter experts
Step: 2 Unlock
Step: 3 Unlock