

Question: 2. The graph below shows the sampling distribution from StatKey. The basis of this distribution was a sample of 150 Reese's Pieces with 48% orange.
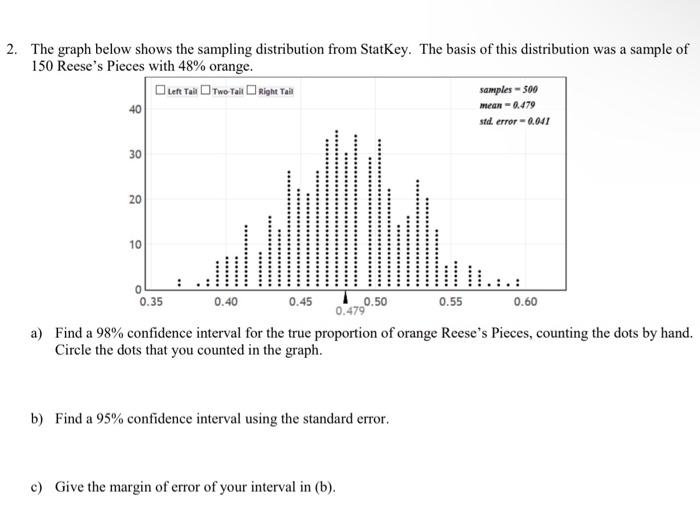
2. The graph below shows the sampling distribution from StatKey. The basis of this distribution was a sample of 150 Reese's Pieces with 48% orange. Left Tall ]Two Tall Right Tail samples = 590 40 mean = 0.479 sid error - 0.041 30 20 10 OL : . : 0.35 0.40 0.45 0.50 0.55 0.60 0.479 a) Find a 98% confidence interval for the true proportion of orange Reese's Pieces, counting the dots by hand. Circle the dots that you counted in the graph. b) Find a 95% confidence interval using the standard error. c) Give the margin of error of your interval in (b)
Step by Step Solution
There are 3 Steps involved in it
1 Expert Approved Answer
Step: 1 Unlock

Question Has Been Solved by an Expert!
Get step-by-step solutions from verified subject matter experts
Step: 2 Unlock
Step: 3 Unlock