

Question: 2. The graph below shows the sampling distribution from StatKey. The basis of this distribution was a sample of 150 Reese's Pieces with 48% orange.
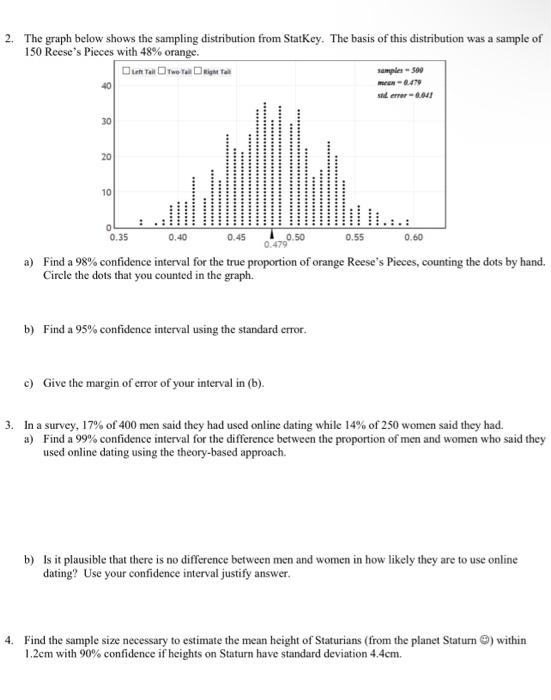
2. The graph below shows the sampling distribution from StatKey. The basis of this distribution was a sample of 150 Reese's Pieces with 48% orange. Left Tail Two Tallight Ta samples-500 men-0.479 std error-0.042 30 20 10 0 0.35 0.40 0.45 0.50 0.55 0.60 0.479 a) Find a 98% confidence interval for the true proportion of orange Reese's Pieces, counting the dots by hand. Circle the dots that you counted in the graph. b) Find a 95% confidence interval using the standard error. c) Give the margin of error of your interval in (b). 3. In a survey, 17% of 400 men said they had used online dating while 14% of 250 women said they had. a) Find a 99% confidence interval for the difference between the proportion of men and women who said they used online dating using the theory-based approach. b) Is it plausible that there is no difference between men and women in how likely they are to use online dating? Use your confidence interval justify answer. 4. Find the sample size necessary to estimate the mean height of Staturians (from the planet Staturn ) within 1.2cm with 90% confidence if heights on Staturn have standard deviation 4.4cm. ******
Step by Step Solution
There are 3 Steps involved in it

Get step-by-step solutions from verified subject matter experts