

Question: 2. The image below displays two normal curves. Use these to answer the questions below. Curve B Curve A 26 28 30 32 34 36
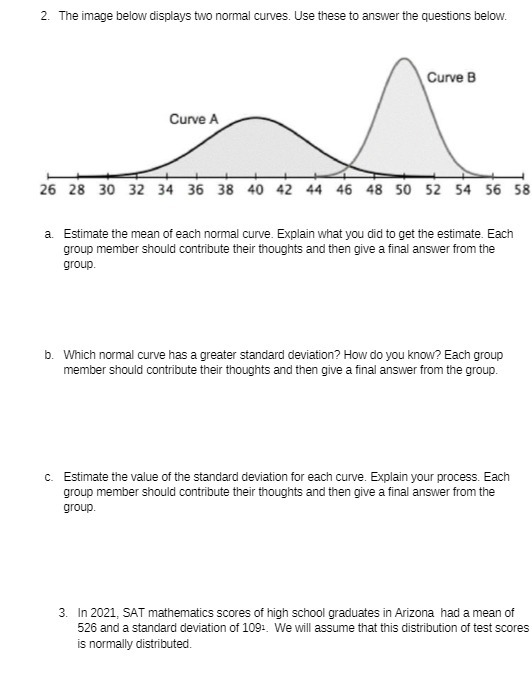
2. The image below displays two normal curves. Use these to answer the questions below. Curve B Curve A 26 28 30 32 34 36 3B 40 42 44 46 4B 50 52 54 56 58 a. Estimate the mean of each normal curve. Explain what you did to get the estimate. Each group member should contribute their thoughts and then give a final answer from the group. b. Which normal curve has a greater standard deviation? How do you know? Each group member should contribute their thoughts and then give a final answer from the group. c. Estimate the value of the standard deviation for each curve. Explain your process. Each group member should contribute their thoughts and then give a final answer from the group. 3. In 2021, SAT mathematics scores of high school graduates in Arizona had a mean of 526 and a standard deviation of 109:. We will assume that this distribution of test scores is normally distributed
Step by Step Solution
There are 3 Steps involved in it

Get step-by-step solutions from verified subject matter experts