

Question: 2. The incomplete frequency distribution table given below represents the score of an exam in a math class. (a) (1 point) Find the class width
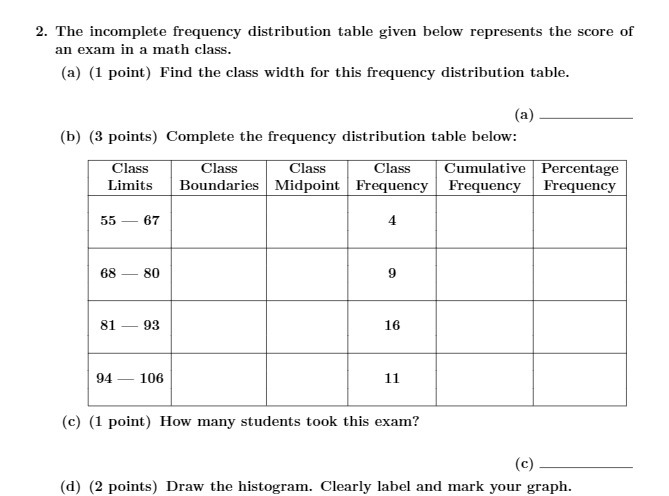
2. The incomplete frequency distribution table given below represents the score of an exam in a math class. (a) (1 point) Find the class width for this frequency distribution table. (a) (b) (3 points) Complete the frequency distribution table below: Class Class Class Class Cumulative Percentage Limits Boundaries Midpoint Frequency Frequency Frequency 55 - 67 68 - 80 9 81 93 16 94 - 106 11 (c) (1 point) How many students took this exam? (c) (d) (2 points) Draw the histogram. Clearly label and mark your graph
Step by Step Solution
There are 3 Steps involved in it
1 Expert Approved Answer
Step: 1 Unlock

Question Has Been Solved by an Expert!
Get step-by-step solutions from verified subject matter experts
Step: 2 Unlock
Step: 3 Unlock