

Question: 2. The plot below represents cumulative cash position of a company. Study the plot and answer the following questions, CUMULATIVE CASH FLOW 3.0 2.0 1
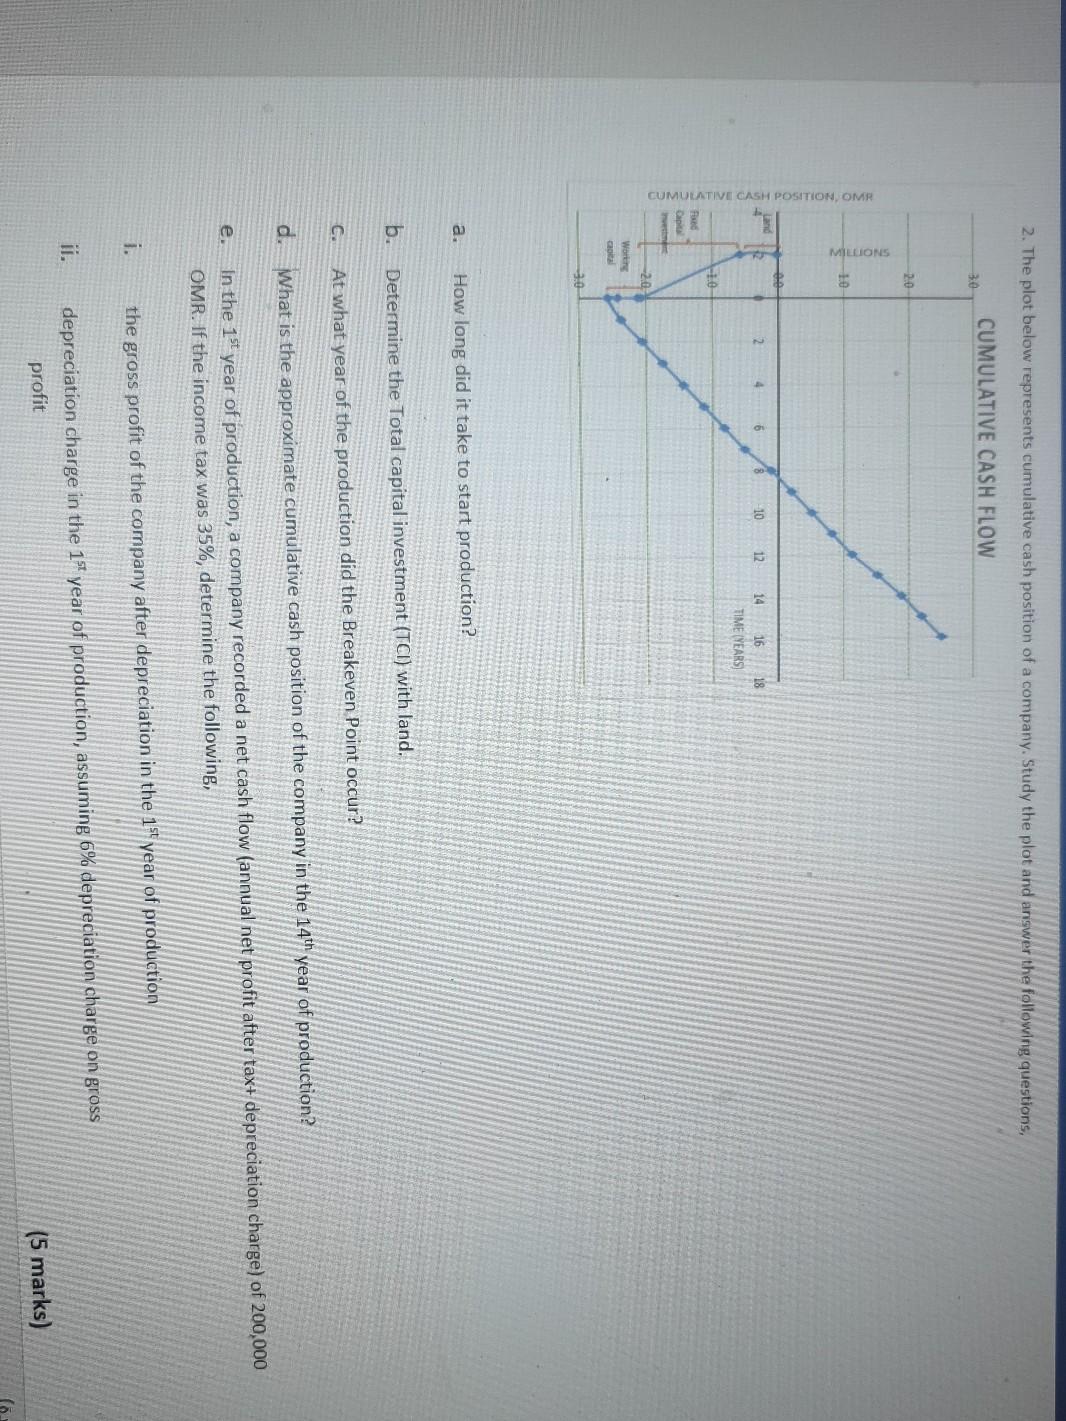
2. The plot below represents cumulative cash position of a company. Study the plot and answer the following questions, CUMULATIVE CASH FLOW 3.0 2.0 1 MILLIONS CUMULATIVI CASH POSITION OMR Land 10 12 18 14 16 TIME (YEARS Fan Capital -2.0 Worth cal a. How long did it take to start production? b. Determine the Total capital investment (TCI) with land. C. At what year of the production did the Breakeven Point occur? d. What is the approximate cumulative cash position of the company in the 14th year of production? e. In the 1st year of production, a company recorded a net cash flow (annual net profit after tax+ depreciation charge) of 200,000 OMR. If the income tax was 35%, determine the following, i. the gross profit of the company after depreciation in the 15 year of production ii. depreciation charge in the 1st year of production, assuming 6% depreciation charge on gross profit
Step by Step Solution
There are 3 Steps involved in it

Get step-by-step solutions from verified subject matter experts