Question: Read the case Ford Motor Company: Basic Financial Ratios and answer the questions below: Questions: As a current investor, what is your overall assessment of
Read the case "Ford Motor Company: Basic Financial Ratios" and answer the questions below:
Questions:
As a current investor, what is your overall assessment of Ford?
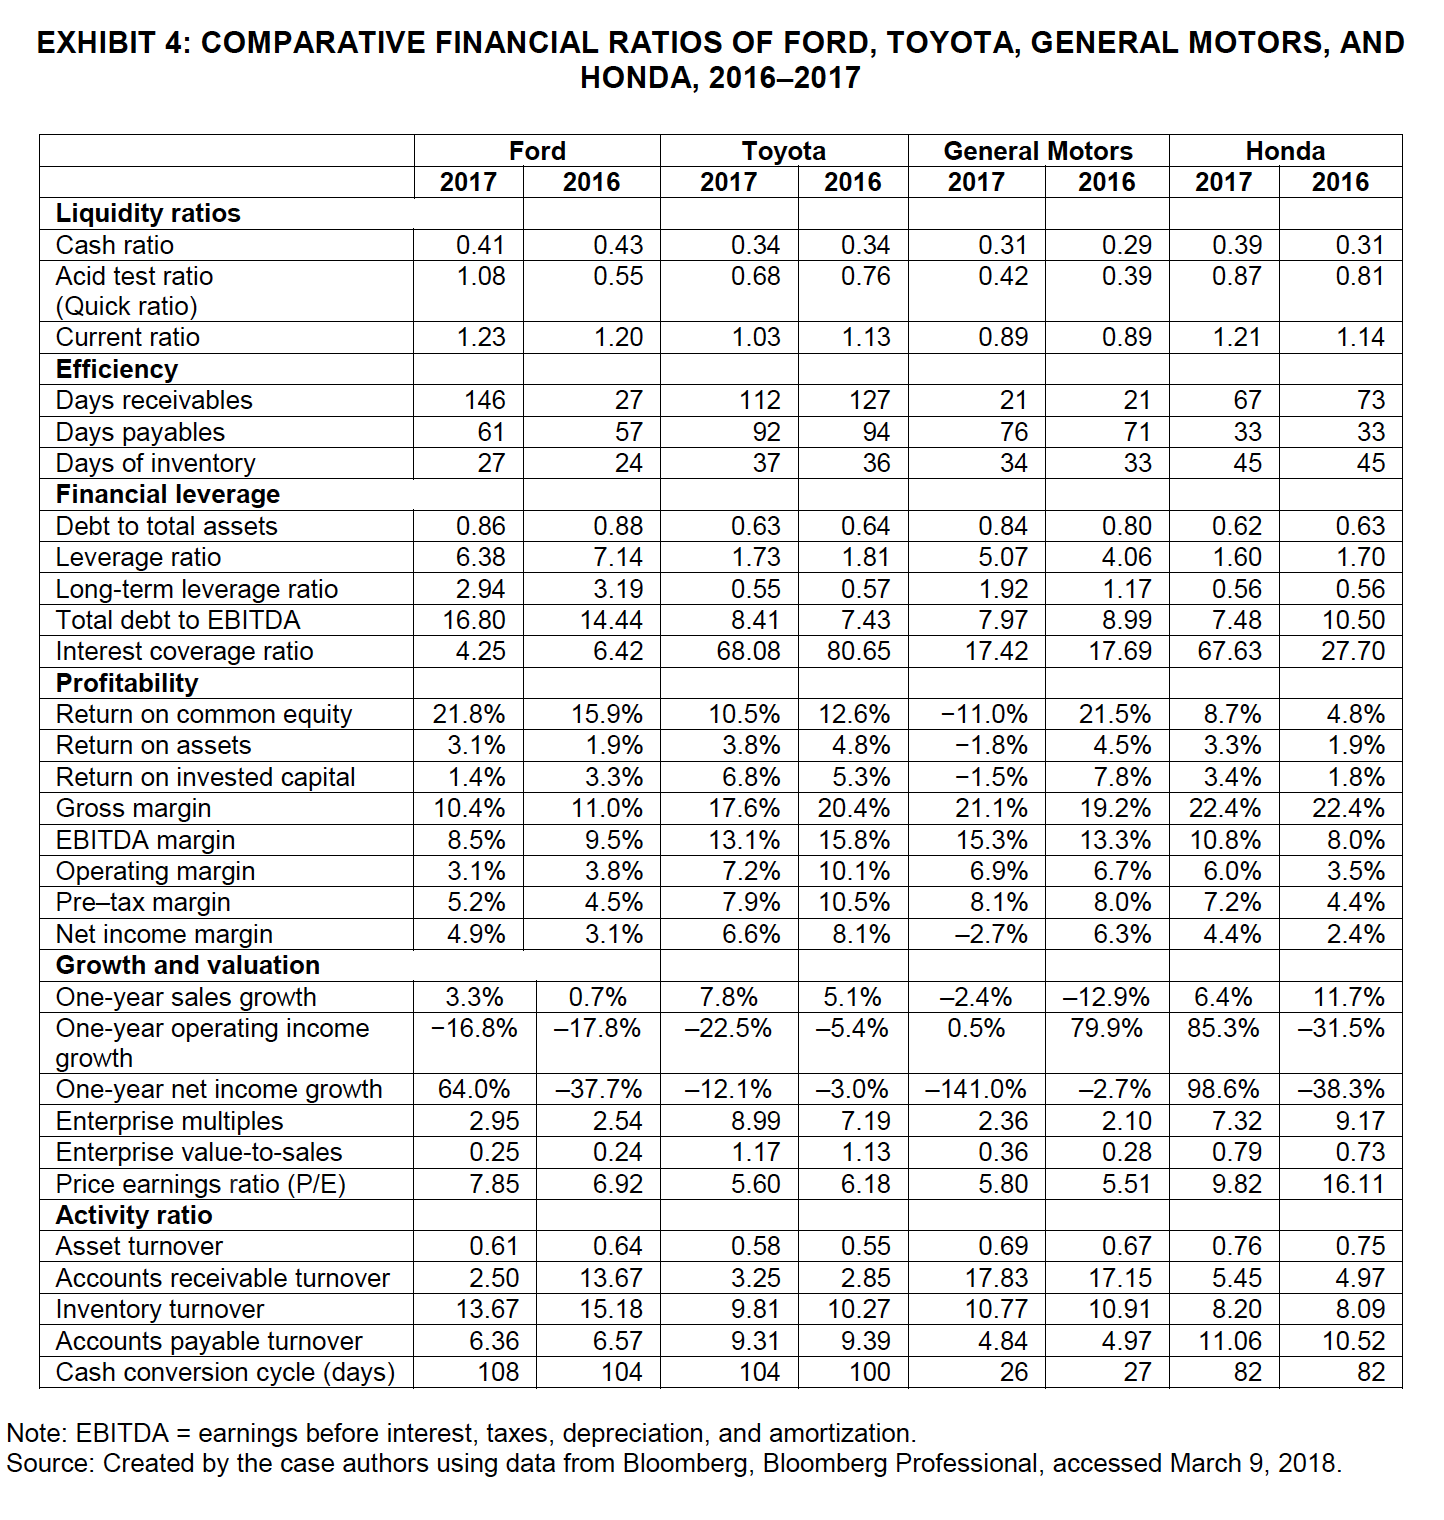
How would you describe Ford's comparative performance and financial position? Examine Ford's financial ratios. What does each ratio tell you about Ford's financial status?
As a current investor in Ford, which elements of financial performance are most important?
As John Smith in January 2018, would you buy more Ford stock, continue to hold current Ford stock, or sell the Ford stock? If you decide to sell in which other automotive manufacturers, would you invest?
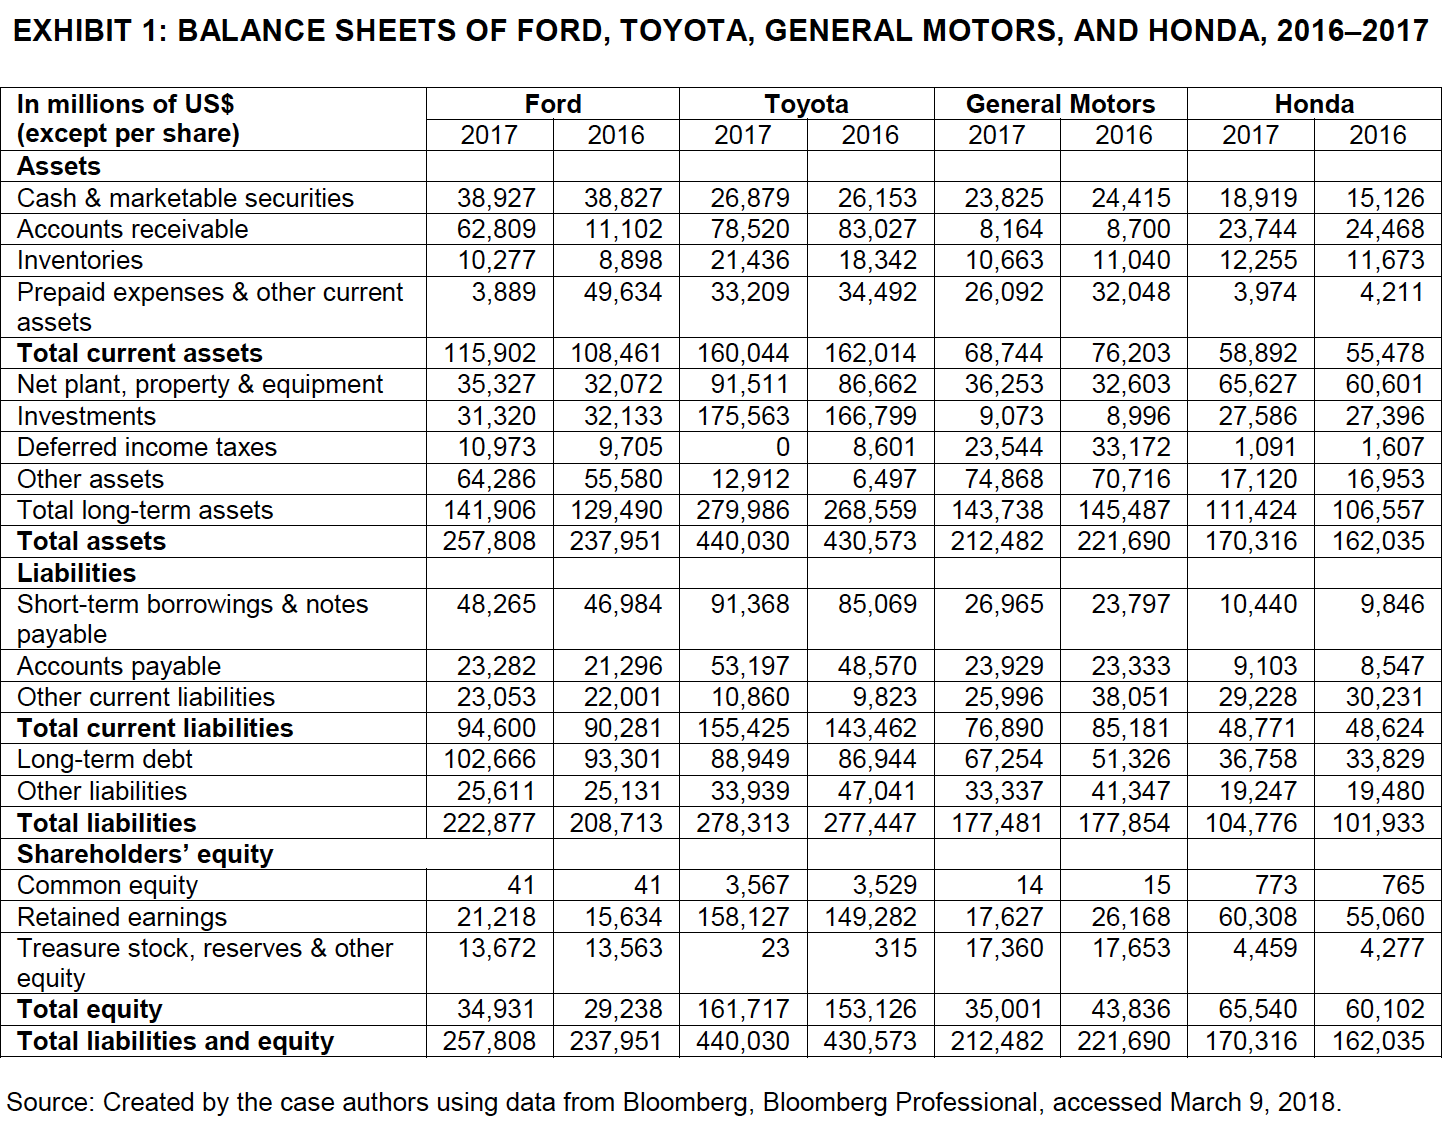
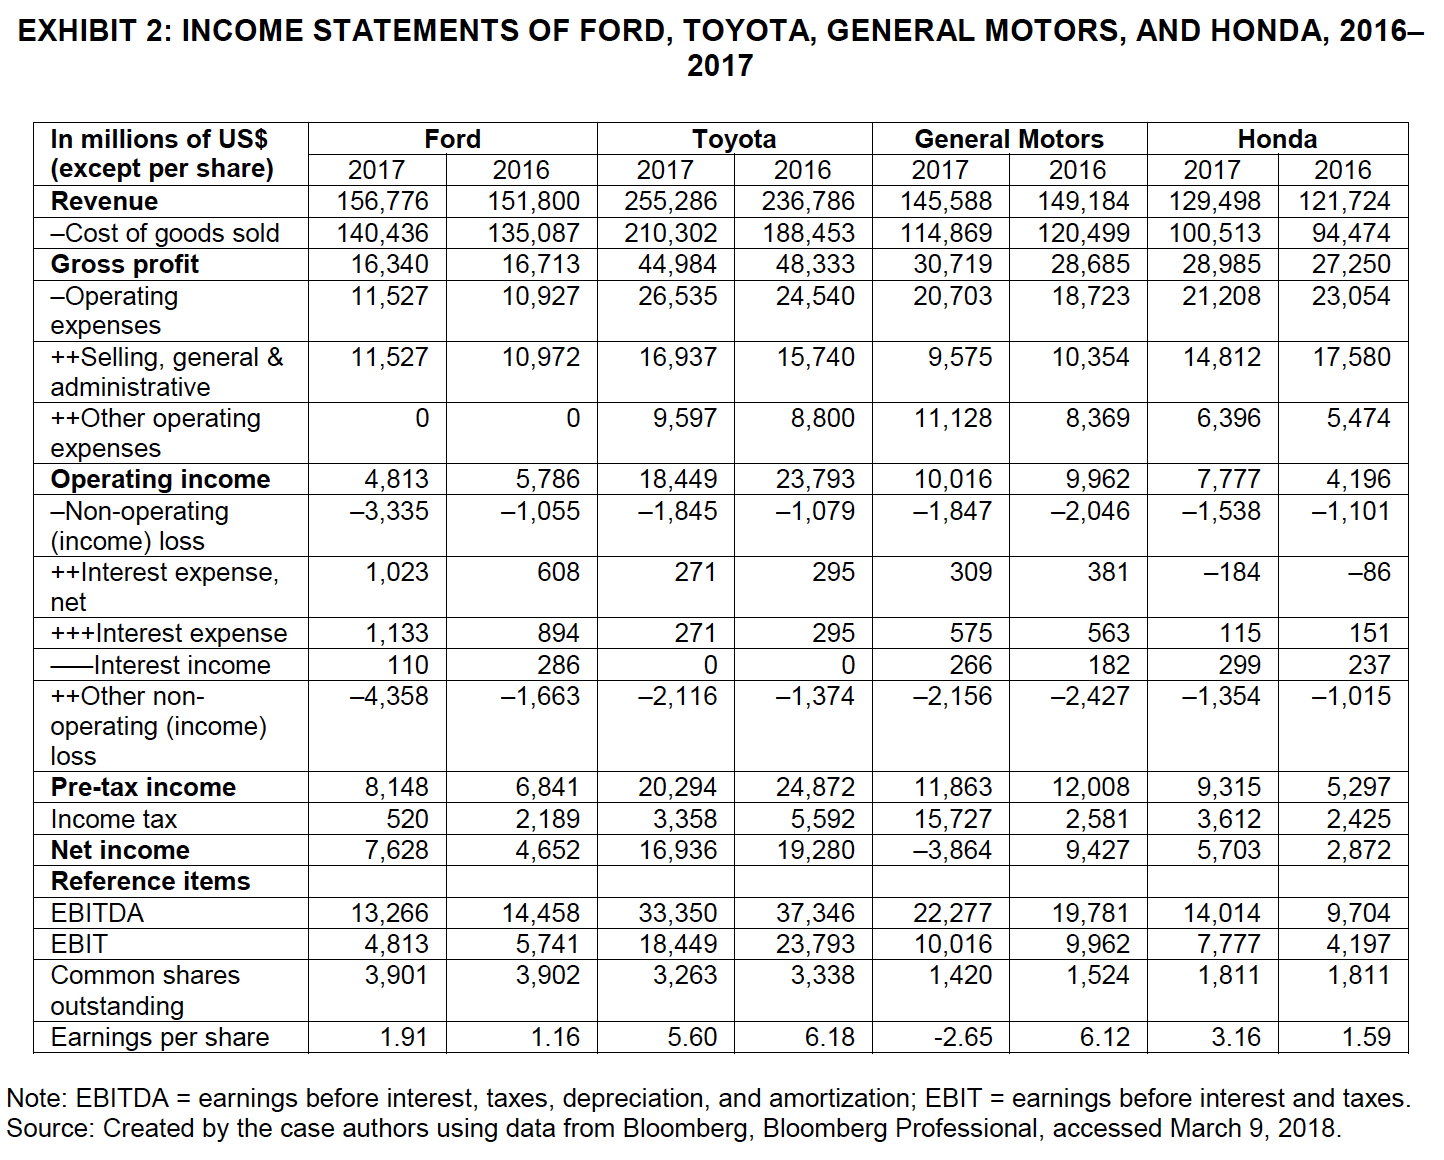
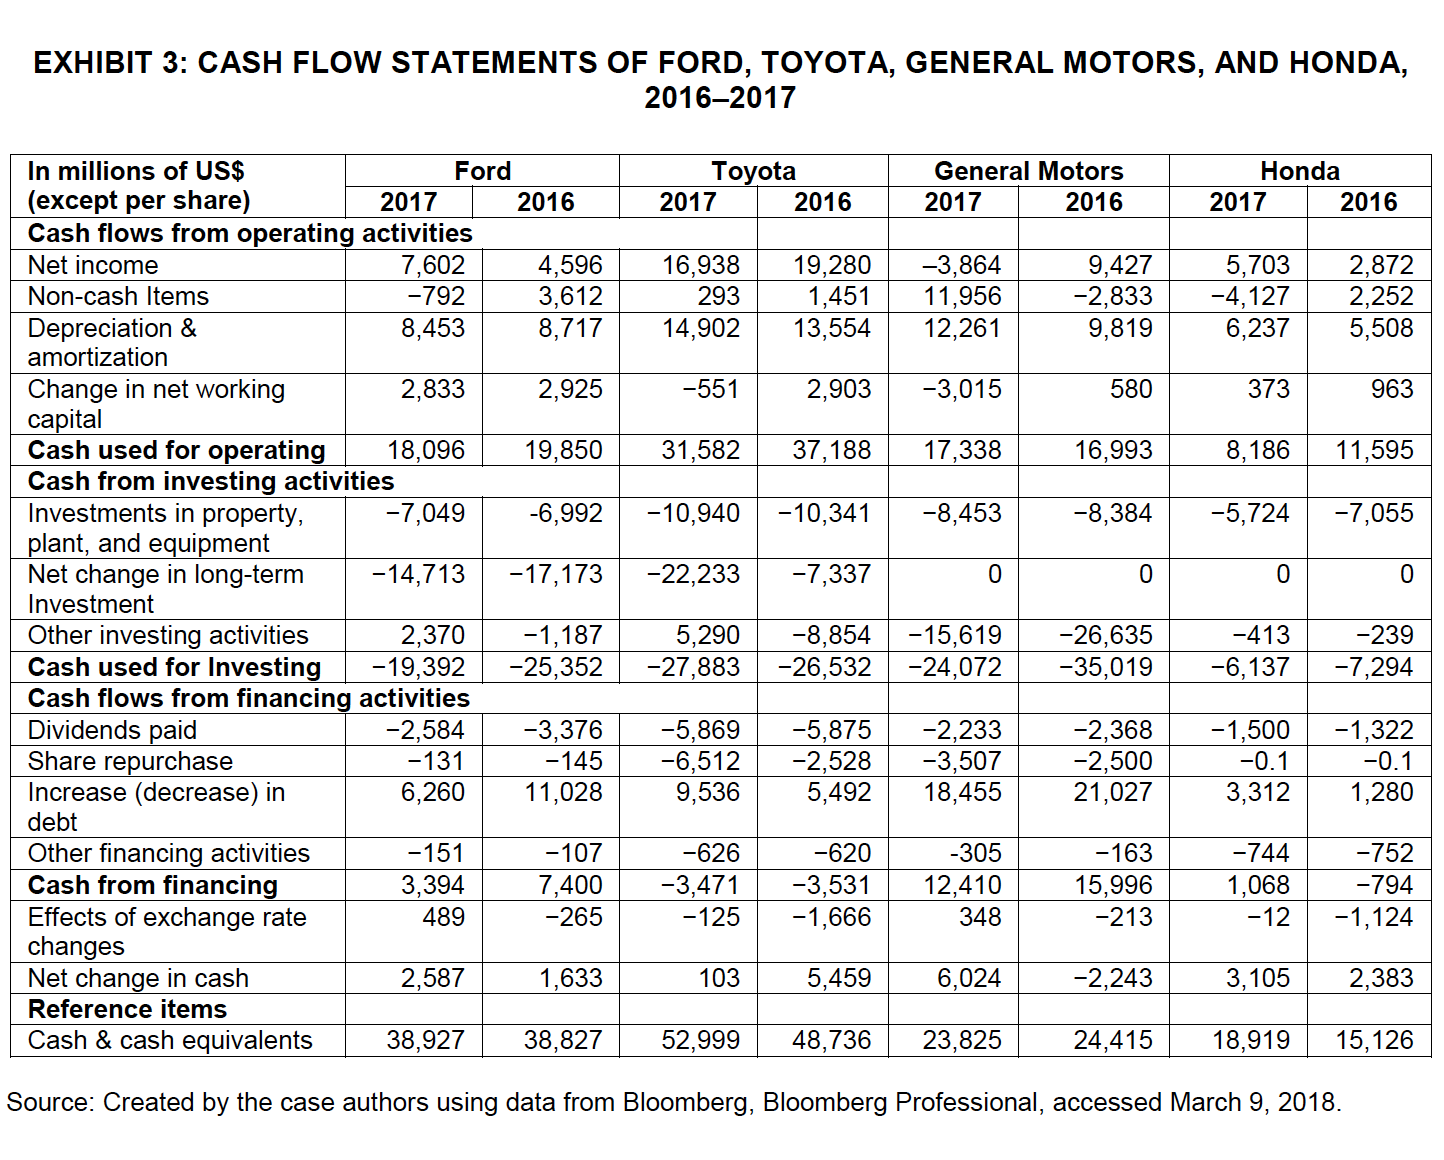
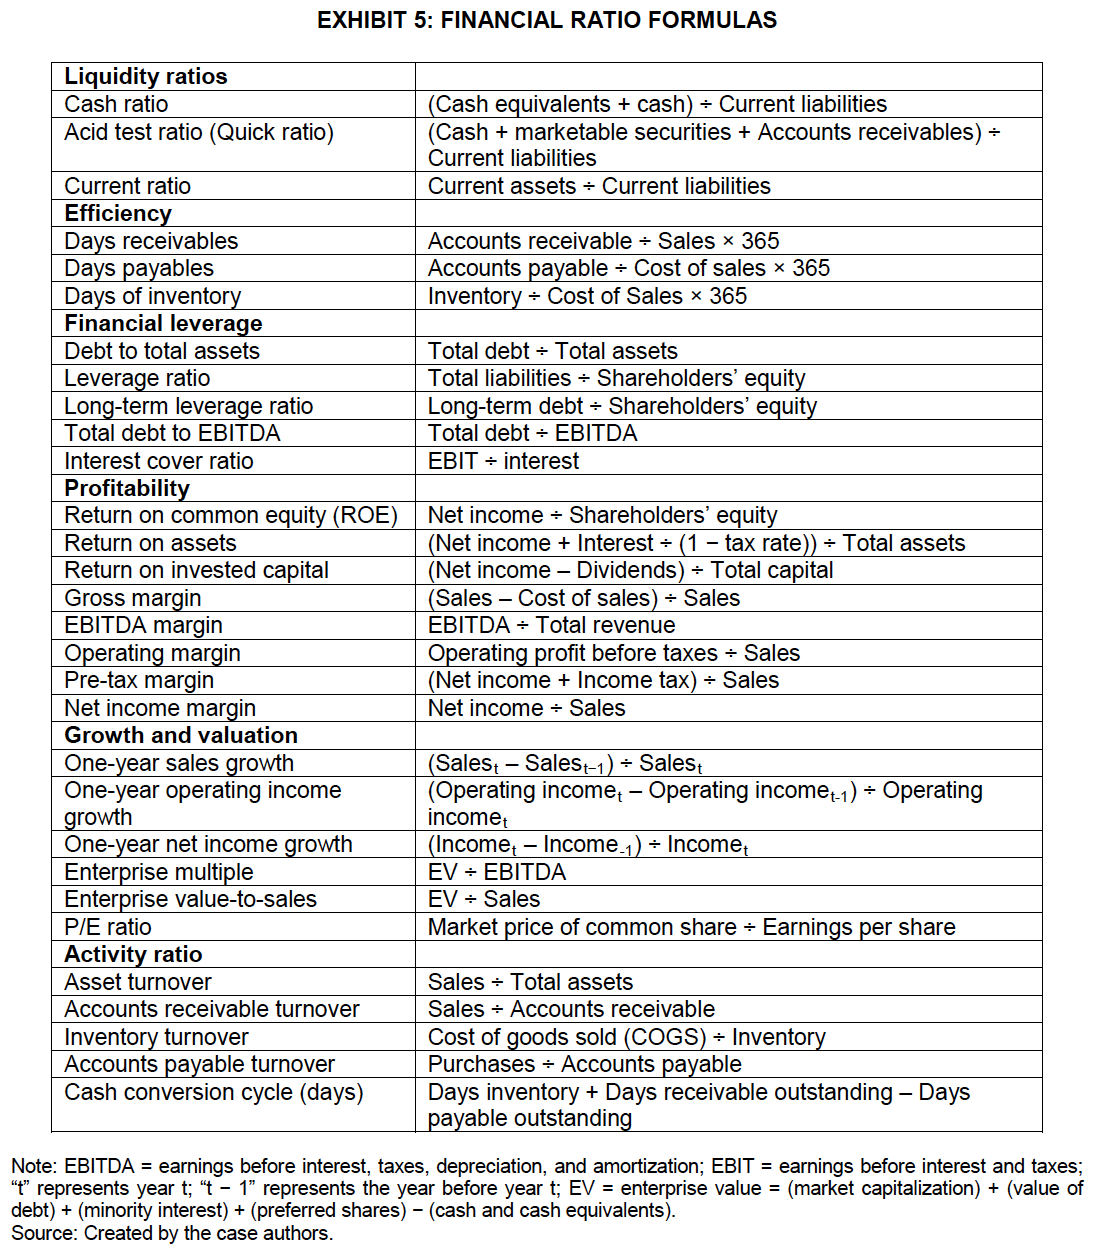
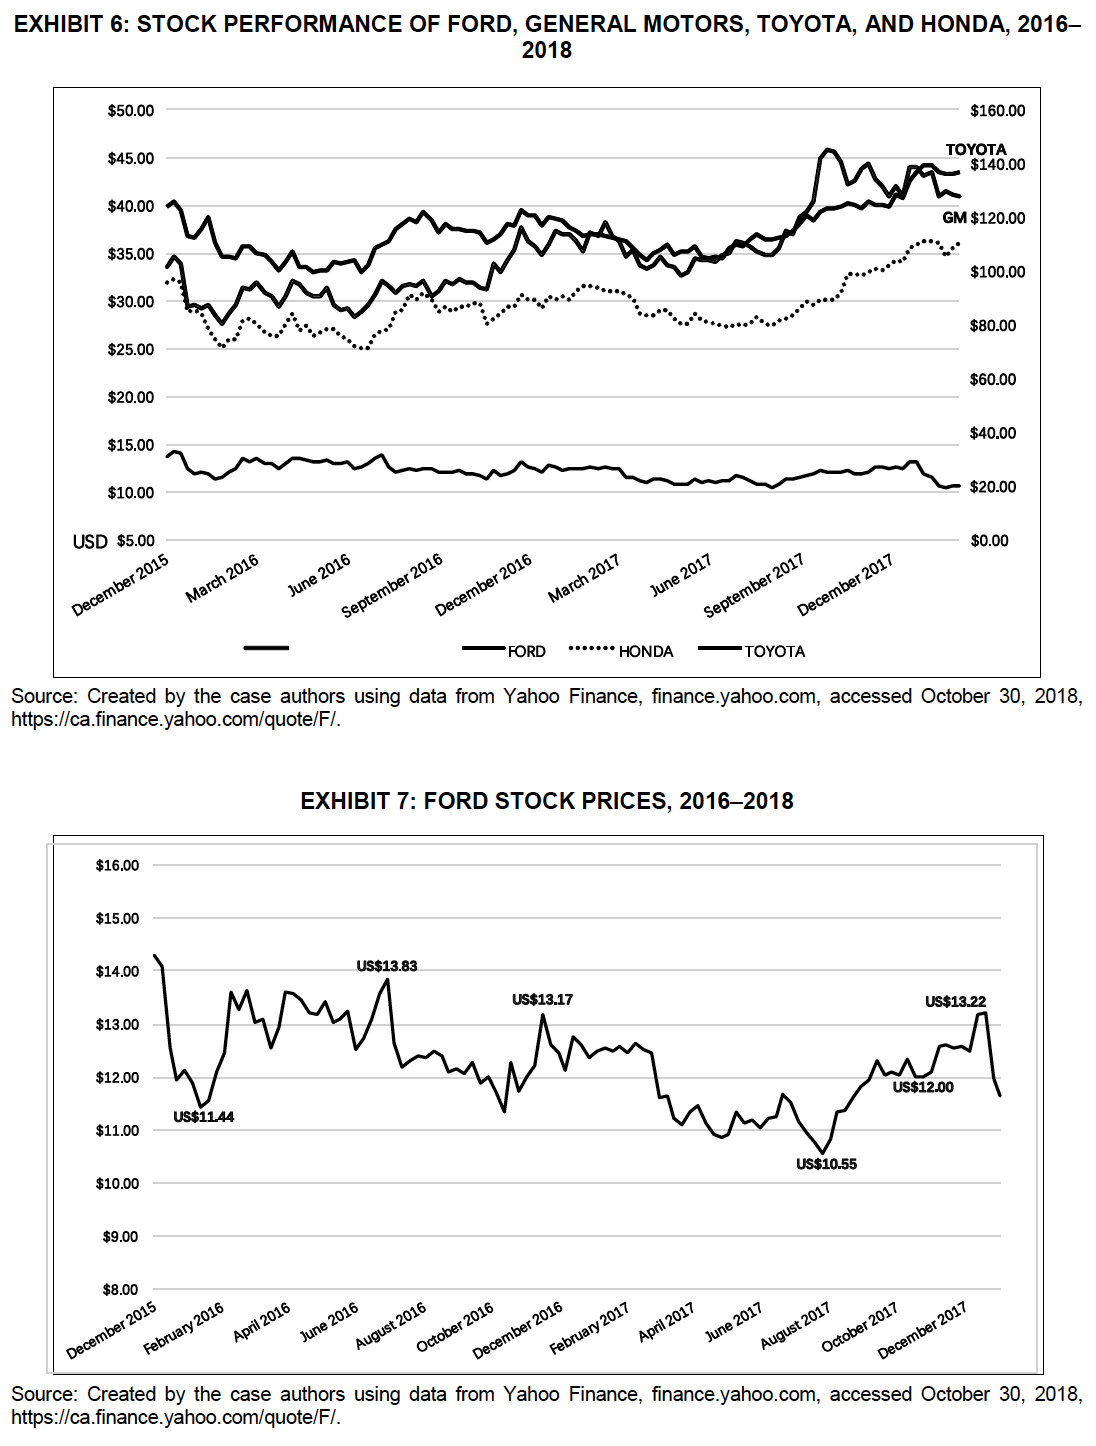
On January 16, 2018, John Smith, a portfolio manager at Uria Investment, was made aware of the Ford Motor Company (Ford) safety recall schedule. Ford announced that 1t would recall more than one million vehicles worldwide as a result of faulty airbags that had failed to deploy upon collision, causing multiple deaths. Tt turned out that Ford had been aware of these faulty airbags but had not taken proactive measures to mitigate potential damage. This information was uncovered by the U.S. regulators who were investigating the multiple deaths in Ford vehicles. Because of the investigation, Ford's share price dropped from US$13.10 to US$12.18 per share on January 17, 2018. Smith was trying to anticipate the future of Ford, as the holding of the Ford equity represented a significant portion of his investment portfolios. Investors had already started contacting him about the future of the company and the state of their investments. Smith anticipated that given the recent announcement, Ford's share value would drop drastically, so he needed to act fast to mitigate the loss of value for his mnvestors. Smith wondered whether Ford could recover from this disaster in the long term and whether its product safety would continue to be an issue and negatively affect its shareholders. While exploring different companies as potential places to reinvest the money, Smith wanted to remain in the automotive industry to maintain the portfolios' diversification. He had thus explored other companies such as Toyota Motor Corporation (Toyota), General Motors Company (GM), and Honda Motor Company Ltd. (Honda) as possible alternatives to Ford. FORD MOTOR COMPANY Ford Motor Company, headquartered in Dearborn, Michigan, was an American multinational automobile manufacturer founded by Henry Ford in 1903. It was the second-largest automobile manufacturer based in the United States and employed approximately 202,000 workers worldwide.* The company had been publicly incorporated since 1956; however, the Ford family continued to retain 40 per cent of its voting rights.\" Ford sold automobiles under the Ford brand, while its luxury automobiles were sold under the Lincoln brand. Ford specialized in large-scale manufacturing by using an industrial workforce. It had incorporated moving assembly lines into its plant operations and used modern economic and social systems to facilitate mass production. This method of production became known as Fordism and was widely applied to improve productivity within the industry. In addition, Ford aimed to maintain a lean mventory by adopting just-in-time inventory management. INDUSTRY AND ECONOMIC CONDITIONS Global automotive sales had increased by 5.6 per cent in 2016. Asian-Pacific markets had seen the highest growth and volume of automotive sales in 2016. The key contributor to the increase in sales was the Chinese market, given its high double-digit growth. In North America, the United States had seen a growth rate of 0.4 per cent in 2016, with 17.55 million cars solda record number. ' It was good news for the shrinking industry in the United States. The slowly improving economy and the increasing demand for trucks and SUVs seemed to finally turn the business around, at least for the time being. Global automotive unit sales continued to grow and reached 86.05 million units in 2017. The growth rate of the global automotive industry was expected to be about 3 per cent annually in 2017 and 2018.\" Sales of electric cars were expected to take up a larger share of the overall market, with most of the growth coming from China and Europe. '' Overall, the 2017 year-end conditions were positive, with both global and domestic conditions showing improvements. Analysts and consumers expected these positive trends to continue into the near future. The World Bank forecasted global economic growth to increase to 3.1 per cent, with advanced economies expected to grow at a more conservative 2.9 per cent.'' Overall, consumer confidence increased; however, this consumer confidence was accompanied with the risk of overinflated asset prices and heightened equity prices.'* The auto manufacturing industry had seen a trend toward electrification and digitalization solutions. In addition, autonomous driving was just becoming another key trend expected to continue into the long-term future. In both technologies, Tesla Inc. had been a market leader, but other major players were also ramping up their investments by partnering with non-traditional technology companies to mtroduce new car models powered by new technologies. In January 2018, Ford pledged to spend $11 billion on electric cars by 2022, which doubled its original investment estimate.\"\" Regional start-ups were also entering the electric vehicle market, spurred by the $2 billion that had been invested in these start-up companies.'* The share of diesel engines in Europe was declining and expected to continue shrinking due to tightening regulations.\" Besides Europe, countries across the world, including major markets such as China and India, were planning to introduce bans and regulations on diesel cars.' As a result, automotive companies saw a rise in environmental regulations, increasing their overall costs, while the increasing cost of fuel had reduced the demand for fuel-engine cars. THE ALTERNATIVES Smith and his team identified Ford's main competitors to be GM, Toyota, and Honda. These companies competed directly with Ford, and thus represented viable alternatives to the Ford stock. GM was an American multinational corporation headquartered in Detroit's Renaissance Center. The company designed, manufactured, and distributed vehicles and vehicle parts, and was the second-largest automobile manufacturer in the world and the largest in the United States. GM had a strong position in the U.S. automotive market. The company's best-known auto brands were Cadillac, Chevrolet, GMC, Holden, and Wuling."' Toyota, the biggest automotive manufacturer in the world, was a Japanese multinational automotive manufacturer headquartered in Toyota, Japan. Toyota was by far the world's leader in the sales of hybrid electric vehicles, having successfully applied its mass-production strategy to its line of hybrid electric vehicles. According to Toyota, 80 per cent of Toyota cars sold in 1998 were still on the road.' Honda was a Japanese public multinational conglomerate corporation primarily known as a manufacturer of automobiles, aircraft, motorcycles, and power equipment. Since 1959, Honda had been the world's largest motorcycle manufacturer. Furthermore, Honda was the world's largest manufacturer of mternal combustion engines measured by volume. In 2013, Honda became the first Japanese automaker to be a net exporter to the United States. " THE ANALYSIS The team at Uria Investment had all of the information available to make their decision. They had the comparative financial informationbalance sheets (see Exhibit 1), income statements (see Exhibit 2), and statements of cash flow (see Exhibit 3)}for the four companies, as well as the financial ratios (see Exhibits 4 and 5). Smith had also reviewed Ford's stock price and was taking into consideration analyst forecasts for the stock price, as compared with its competitors (see Exhibits 6 and 7). Ford's stock had fluctuated slightly during 2017, but the closing stock price was within the same range as at the beginning of the year. When Smith initially invested in Ford, he believed it would translate into long-term growth and profits for his clients. However, as he analyzed the situation, Smith was unsure whether Ford could recover from the numerous safety scandals while simultaneously catching up to competitors in terms of innovation. Smith and his team wondered what this mformation would uncover and how it would lead to the final decision. EXHIBIT 1: BALANCE SHEETS OF FORD, TOYOTA, GENERAL MOTORS, AND HONDA, 2016-2017 In millions of US$ Ford Toyota General Motors Honda (except per share) 2017 2016 2017 2016 2017 2016 2017 2016 Assets Cash & marketable securities 38,927 38,827 26,879 26,153 23,825 24,415 18,919 15,126 Accounts receivable 62,809 11,102 78,520 83,027 8,164 8,700 23,744 24,468 Inventories 10,277 8,898 21,436 18,342 10,663 11,040 12,255 11,673 Prepaid expenses & other current 3,889 49,634 33,209 34,492 26,092 32,048 3,974 4,211 assets Total current assets 115,902 | 108,461 | 160,044 | 162,014 68,744 76,203 58,892 55,478 Net plant, property & equipment 35,327 32,072 91,511 86,662 36,253 32,603 65,627 60,601 Investments 31,320 32,133 | 175,563 | 166,799 9,073 8,996 27,586 27,396 Deferred income taxes 10,973 9,705 0 8,601 23,544 33,172 1,091 1,607 Other assets 64,286 55,580 12,912 6,497 74,868 70,716 17,120 16,953 Total long-term assets 141,906 | 129,490 | 279,986 | 268 559 | 143,738 | 145487 | 111,424 | 106,557 Total assets 257,808 | 237,951 | 440,030 | 430,573 | 212,482 | 221,690 | 170,316 | 162,035 Liabilities Short-term borrowings & notes 48,265 46,984 91,368 85,069 26,965 23,797 10,440 9,846 payable Accounts payable 23,282 21,296 53,197 48,570 23,929 23,333 9,103 8,547 Other current liabilities 23,053 22,001 10,860 9,823 25,996 38,051 29,228 30,231 Total current liabilities 94,600 90,281 | 155,425 | 143,462 76,890 85,181 48,771 48,624 Long-term debt 102,666 93,301 88,949 86,944 67,254 51,326 36,758 33,829 Other liabilities 25,611 25,131 33,939 47,041 33,337 41,347 19,247 19,480 Total liabilities 222877 | 208,713 | 278,313 | 277,447 | 177,481 | 177,854 | 104,776 | 101,933 Shareholders' equity Common equity 41 41 3,567 3,629 14 15 773 765 Retained earnings 21,218 15,634 | 158,127 | 149,282 17,627 26,168 60,308 55,060 Treasure stock, reserves & other 13,672 13,563 23 315 17,360 17,653 4.459 4277 equity Total equity 34,931 29,238 | 161,717 | 153,126 35,001 43,836 65,540 60,102 Total liabilities and equity 257,808 | 237,951 | 440,030 | 430,573 | 212,482 | 221,690 | 170,316 | 162,035 Source: Created by the case authors using data from Bloomberg, Bloomberg Professional, accessed March 9, 2018. EXHIBIT 2: INCOME STATEMENTS OF FORD, TOYOTA, GENERAL MOTORS, AND HONDA, 2016- 2017 In millions of US$ Ford Toyota General Motors Honda (except per share) 2017 2016 2017 2016 2017 2016 2017 2016 Revenue 156,776 151,800 255,286 236,786 145,588 149, 184 129,498 121,724 -Cost of goods sold 140,436 135,087 210,302 188,453 114,869 120,499 100,513 94,474 Gross profit 16,340 16,713 44,984 48,333 30,719 28,685 28,985 27,250 -Operating 11,527 10,927 26,535 24,540 20,703 18,723 21,208 23,054 expenses ++Selling, general & 11,527 10,972 16,937 15,740 9,575 10,354 14,812 17,580 administrative ++Other operating 0 0 9,597 8,800 11, 128 8,369 6,396 5,474 expenses Operating income 4,813 5,786 18,449 23,793 10,016 9,962 7,777 4, 196 -Non-operating -3,335 -1,055 -1,845 -1,079 -1,847 -2,046 -1,538 -1, 101 (income ) loss ++Interest expense, 1,023 608 271 295 309 381 -184 -86 net +++Interest expense 1,133 894 271 295 575 563 115 151 Interest income 1 10 286 0 0 266 182 299 237 ++Other non- -4,358 -1,663 -2, 116 -1,374 -2, 156 -2,427 -1,354 -1,015 operating (income) loss Pre-tax income 8,148 6,841 20,294 24,872 11,863 12,008 9,315 5,297 Income tax 620 2, 189 3,358 5,592 15,727 2,581 3,612 2,425 Net income 7,628 4,652 16,936 19,280 -3,864 9,427 5,703 2,872 Reference items EBITDA 13,266 14,458 33,350 37,346 22,277 19,781 14,014 9,704 EBIT 4,813 5,741 18,449 23,793 10,016 9,962 7,777 4, 197 Common shares 3,901 3,902 3,263 3,338 1,420 1,524 1,811 1,811 outstanding Earnings per share 1.91 1.16 5.60 6.18 -2.65 6.12 3.16 1.59 Note: EBITDA = earnings before interest, taxes, depreciation, and amortization; EBIT = earnings before interest and taxes. Source: Created by the case authors using data from Bloomberg, Bloomberg Professional, accessed March 9, 2018.EXHIBIT 3: CASH FLOW STATEMENTS OF FORD, TOYOTA, GENERAL MOTORS, AND HONDA, 2016-2017 In millions of US$ Ford Toyota General Motors Honda (except per share) 2017 2016 2017 2016 2017 2016 2017 2016 Cash flows from operating activities Net income 7,602 4,596 16,938 19,280 -3,864 9,427 5,703 2,872 Non-cash ltems -792 3,612 293 1,451 11,956 -2,833 -4.127 2,252 Depreciation & 8,453 8,717 14,902 13,554 12,261 9,819 6,237 5,508 amortization Change in net working 2,833 2,925 -551 2,903 -3,015 580 373 963 capital Cash used for operating 18,096 19,850 31,582 37,188 17,338 16,993 8,186 | 11,595 Cash from investing activities Investments in property, -7,049 -6,992 | -10,940 | -10,341 -8,453 -8,384 -5,724 -7,055 plant, and equipment Net change in long-term -14,713 | 17,173 | -22,233 -7,337 0 0 0 0 Investment Other investing activities 2,370 -1,187 5,290 -8,854 | -15,619 -26,635 -413 -239 Cash used for Investing -19,392 | -25,352 | -27,883 | -26,532 | -24,072 -35,019 -6,137 | 7,294 Cash flows from financing activities Dividends paid -2,584 -3,376 -5,869 -5,875 -2,233 -2,368 -1,500 | -1,322 Share repurchase -131 -145 -6,512 -2,528 -3,507 -2,500 -01 -0.1 Increase (decrease) in 6,260 11,028 9,536 5,492 18,455 21,027 3,312 1,280 debt Other financing activities -151 -107 -626 -620 -305 -163 -744 -752 Cash from financing 3,394 7,400 -3,471 -3,531 12,410 15,996 1,068 =794 Effects of exchange rate 489 -265 -125 -1,666 348 -213 -12 -1,124 changes Net change in cash 2,587 1,633 103 5,459 6,024 -2,243 3,105 2,383 Reference items Cash & cash equivalents 38,927 38,827 52,999 48,736 23,825 24 415 18,919 | 15126 Source: Created by the case authors using data from Bloomberg, Bloomberg Professional, accessed March 9, 2018. EXHIBIT 4: COMPARATIVE FINANCIAL RATIOS OF FORD, TOYOTA, GENERAL MOTORS, AND HONDA, 2016-2017 Ford Toyota General Motors Honda 2017 2016 2017 2016 2017 2016 2017 2016 Liquidity ratios Cash ratio 0.41 0.43 0.34 0.34 0.31 0.29 0.39 0.31 Acid test ratio 1.08 0.55 0.68 0.76 0.42 0.39 0.87 0.81 (Quick ratio) Current ratio 1.23 1.20 1.03 1.13 0.89 0.89 1.21 1.14 Efficiency Days receivables 146 27 112 127 21 21 67 73 Days payables 61 57 92 94 76 71 33 33 Days of inventory 27 24 37 36 34 33 45 45 Financial leverage Debt to total assets 0.86 0.88 0.63 0.64 0.84 0.80 0.62 0.63 Leverage ratio 6.38 7.14 1.73 1.81 5.07 4.06 1.60 1.70 Long-term leverage ratio 2.94 3.19 0.55 0.57 1.92 1.17 0.56 0.56 Total debt to EBITDA 16.80 14.44 8.41 7.43 7.97 8.99 7.48 10.50 Interest coverage ratio 4.25 6.42 68.08 | 80.65 17.42 17.69 | 67.63 27.70 Profitability Return on common equity 21.8% 15.9% 10.5% | 12.6% -11.0% 21.5% 8.7% 4 8% Return on assets 3.1% 1.9% 3.8% 4.8% -1.8% 4.5% 3.3% 1.9% Return on invested capital 1.4% 3.3% 6.8% 5.3% -1.5% 7.8% 3.4% 1.8% Gross margin 10.4% 11.0% 17.6% | 20.4% 21.1% 19.2% | 22.4% 22 4% EBITDA margin 8.5% 9.5% 13.1% | 15.8% 15.3% 13.3% | 10.8% 8.0% Operating margin 3.1% 3.8% 7.2% | 10.1% 6.9% 6.7% 6.0% 3.5% Pretax margin 5.2% 4.5% 7.9% | 10.5% 8.1% 8.0% 7.2% 4.4% Net income margin 4.9% 3.1% 6.6% 8.1% -2.7% 6.3% 4.4% 2.4% Growth and valuation One-year sales growth 3.3% 0.7% 7.8% 5.1% 2.4% -12.9% | 6.4% 11.7% One-year operating income -16.8% | -17.8% | -22.5% | -5.4% 0.5% 79.9% | 85.3% | -31.5% growth One-year net income growth 64.0% | -37.7% | -12.1% | -3.0% | 141.0% 2.7% | 98.6% | 38.3% Enterprise multiples 2.95 2.54 8.99 7.19 2.36 2.10 7.32 9.17 Enterprise value-to-sales 0.25 0.24 1.17 1.13 0.36 0.28 0.79 0.73 Price earnings ratio (P/E) 7.85 6.92 5.60 6.18 5.80 5.51 9.82 16.11 Activity ratio Asset turnover 0.61 0.64 0.58 0.55 0.69 0.67 0.76 0.75 Accounts receivable turnover 250 13.67 3.25 285 17.83 17.15 5.45 497 Inventory turnover 13.67 15.18 9.81 10.27 10.77 10.91 8.20 8.09 Accounts payable turnover 6.36 6.57 9.31 9.39 4.84 4.97 11.06 10.52 Cash conversion cycle (days) 108 104 104 100 26 27 82 82 Note: EBITDA = earnings before interest, taxes, depreciation, and amortization. Source: Created by the case authors using data from Bloomberg, Bloomberg Professional, accessed March 9, 2018. EXHIBIT 5: FINANCIAL RATIO FORMULAS Liquidity ratios Cash ratio (Cash equivalents + cash) + Current liabilities Acid test ratio (Quick ratio) (Cash + marketable securities + Accounts receivables) + Current liabilities Current ratio Current assets + Current liabilities Efficiency Days receivables Accounts receivable = Sales x 365 Days payables Accounts payable + Cost of sales x 365 Days of inventory Inventory + Cost of Sales x 365 Financial leverage Debt to total assets Total debt + Total assets Leverage ratio Total liabilities + Shareholders' equity Long-term leverage ratio Total debt to EBITDA Long-term debt + Shareholders' equit Total debt + EBITDA Interest cover ratio EBIT + interest Profitability Return on common equity (ROE) Net income = Shareholders' equity Return on assets (Net income + Interest + (1 - tax rate)) + Total assets Return on invested capital (Net income Dividends) + Total capital Gross margin EBITDA margin Sales Cost of sales) + Sales EBITDA = Total revenue Operating margin Operating profit before taxes + Sales Pre-tax margin (Net income + Income tax) + Sales Net income margin Net income = Sales Growth and valuation One-year sales growth (Sales; Sales1) = Sales; One-year operating income growth (Operating income, Operating income, ) + Operating income; One-year net income growth (Income; Income_4) = Income, Enterprise multiple EV = EBITDA Enterprise value-to-sales EV = Sales P/E ratio Market price of common share + Earnings per share Activity ratio Asset turnover Accounts receivable turnover Sales + Total assets Sales + Accounts receivable Inventory turnover Cost of goods sold (COGS) = Inventory Accounts payable turnover Purchases + Accounts payable Cash conversion cycle (days) Days inventory + Days receivable outstanding Days payable outstanding Note: EBITDA = earnings before interest, taxes, depreciation, and amortization; EBIT = earnings before interest and taxes; \"t\" represents year t; \"t = 1\"7 represents the year before year t; EV = enterprise value = (market capitalization) + (value of debt) + (minority interest) + (preferred shares) (cash and cash equivalents). Source: Created by the case authors. EXHIBIT 6: STOCK PERFORMANCE OF FORD, GENERAL MOTORS, TOYOTA, AND HONDA, 2016- 2018 $50.00 $160.00 $45.00 TOYOTA $140.00 $40.00 V GM $120.00 $35.00 $100.00 $30.00 $25.00 $80.00 $20.00 $60.00 $15.00 $40.00 $10.00 - $20.00 USD $5.00 $0.00 December 2015 March 2016 June 2016 September 2016 December 2016 March 2017 June 2017 September 2017 December 2017 FORD ...* *. HONDA -TOYOTA Source: Created by the case authors using data from Yahoo Finance, finance.yahoo.com, accessed October 30, 2018, https://ca.finance.yahoo.com/quote/F/. EXHIBIT 7: FORD STOCK PRICES, 2016-2018 $16.00 $15.00 $14.00 US$13.83 $13.00 US$13.22 $12.00 US$12.00 US$11.44 $11.00 $10.00 US$10.55 $9.00 $8.00 December 2015 February 2016 April 2016 June 2016 August 2016 October 2016 December 2016 February 2017 April 2017 June 2017 August 2017 October 2017 December 2017 Source: Created by the case authors using data from Yahoo Finance, finance.yahoo.com, accessed October 30, 2018, https://ca.finance.yahoo.com/quote/F/
Step by Step Solution
There are 3 Steps involved in it
1 Expert Approved Answer
Step: 1 Unlock
Question Has Been Solved by an Expert!
Get step-by-step solutions from verified subject matter experts
Step: 2 Unlock
Step: 3 Unlock
Students Have Also Explored These Related Finance Questions!