

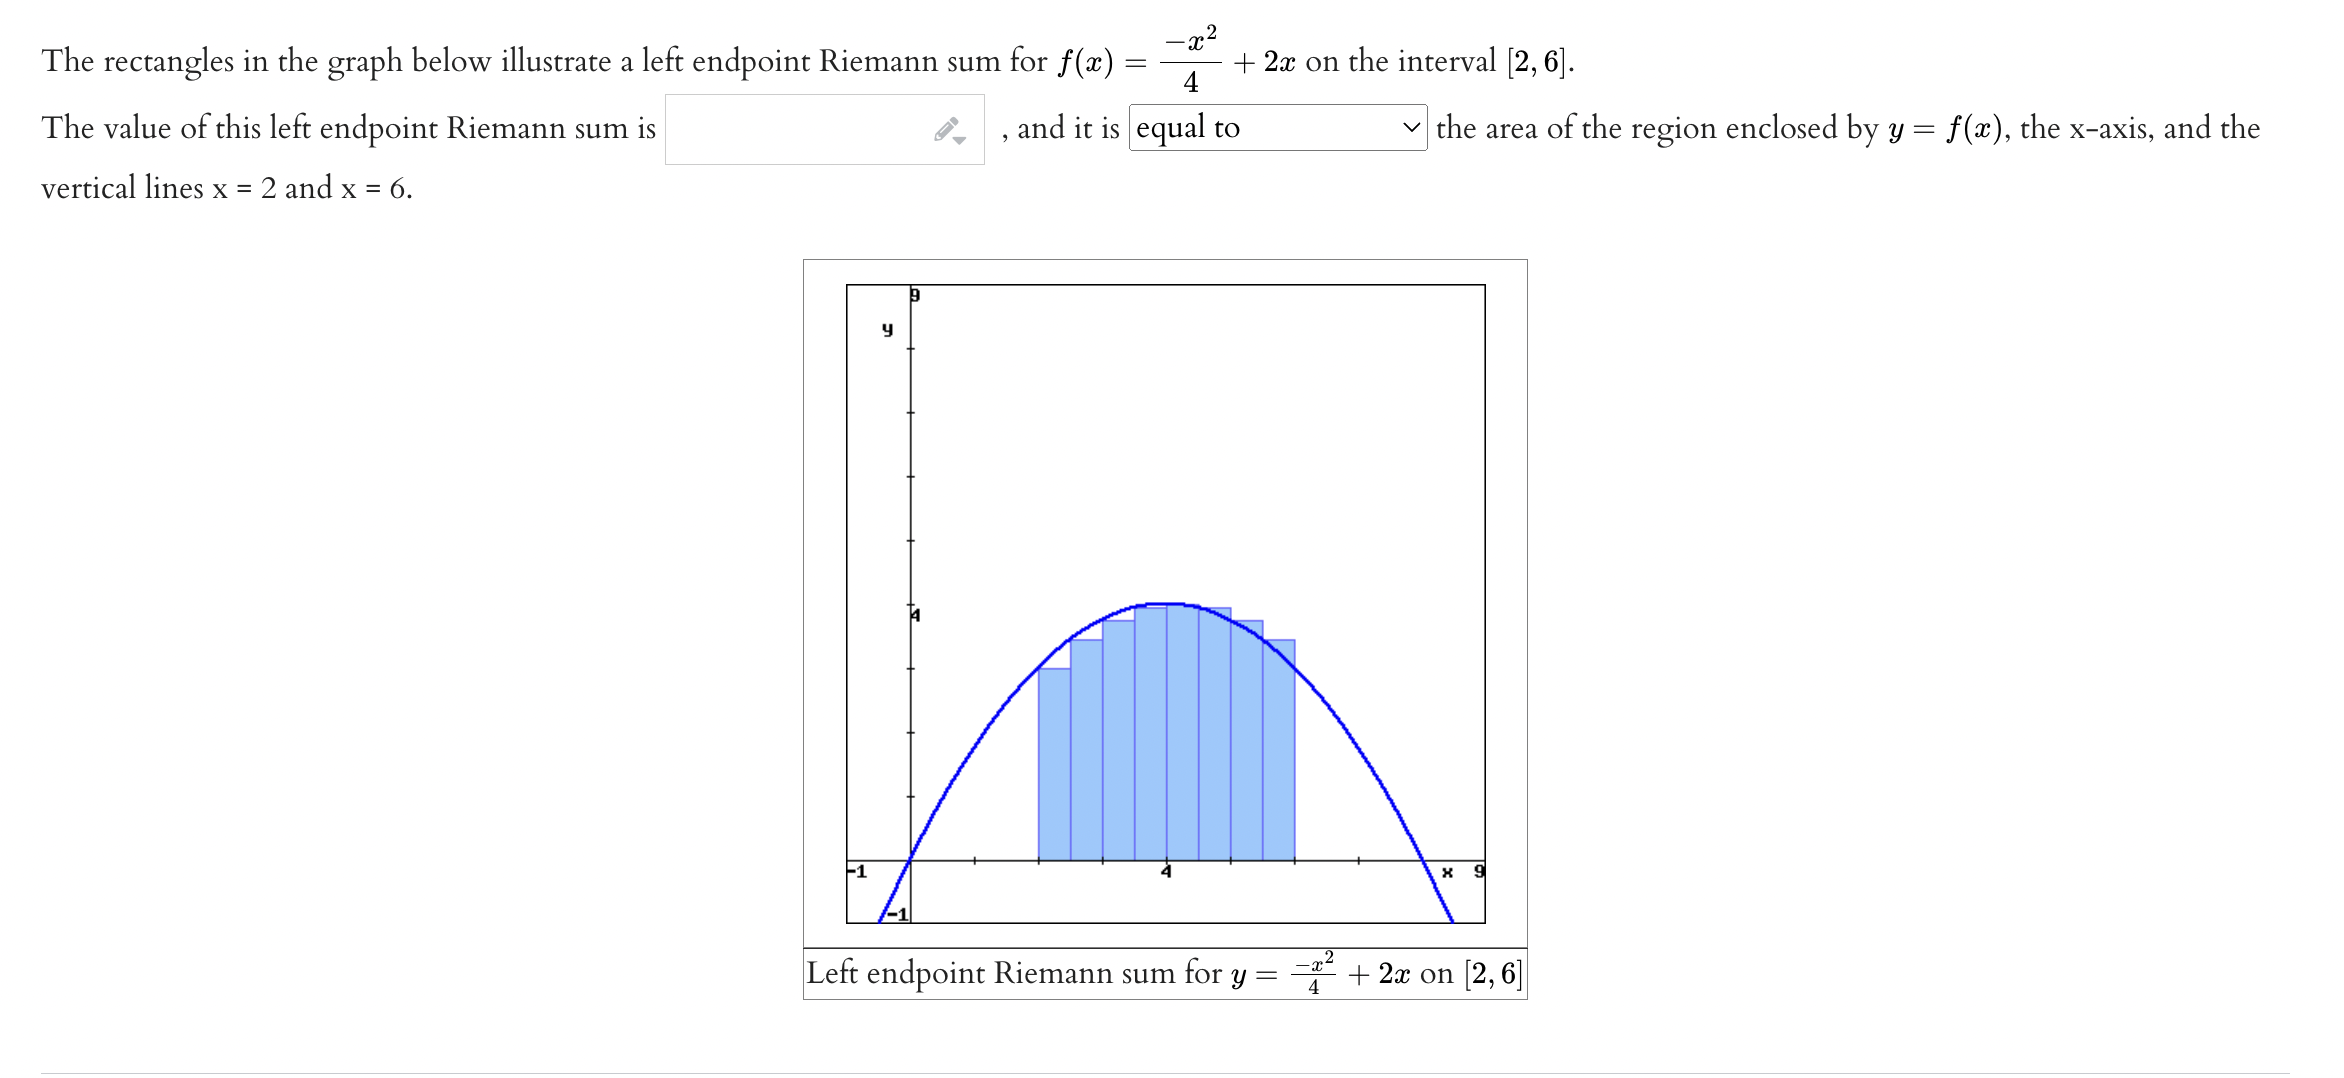
Question: _ 2 The rectangles in the graph below illustrate a left endpoint Riemann sum for f(a:) = Ta: + 2:): on the interval [2, 6].

![[2, 6]. The value of this left endpoint Riemann sum is I"](https://s3.amazonaws.com/si.experts.images/answers/2024/06/667d14697116a_257667d14694f5b0.jpg)

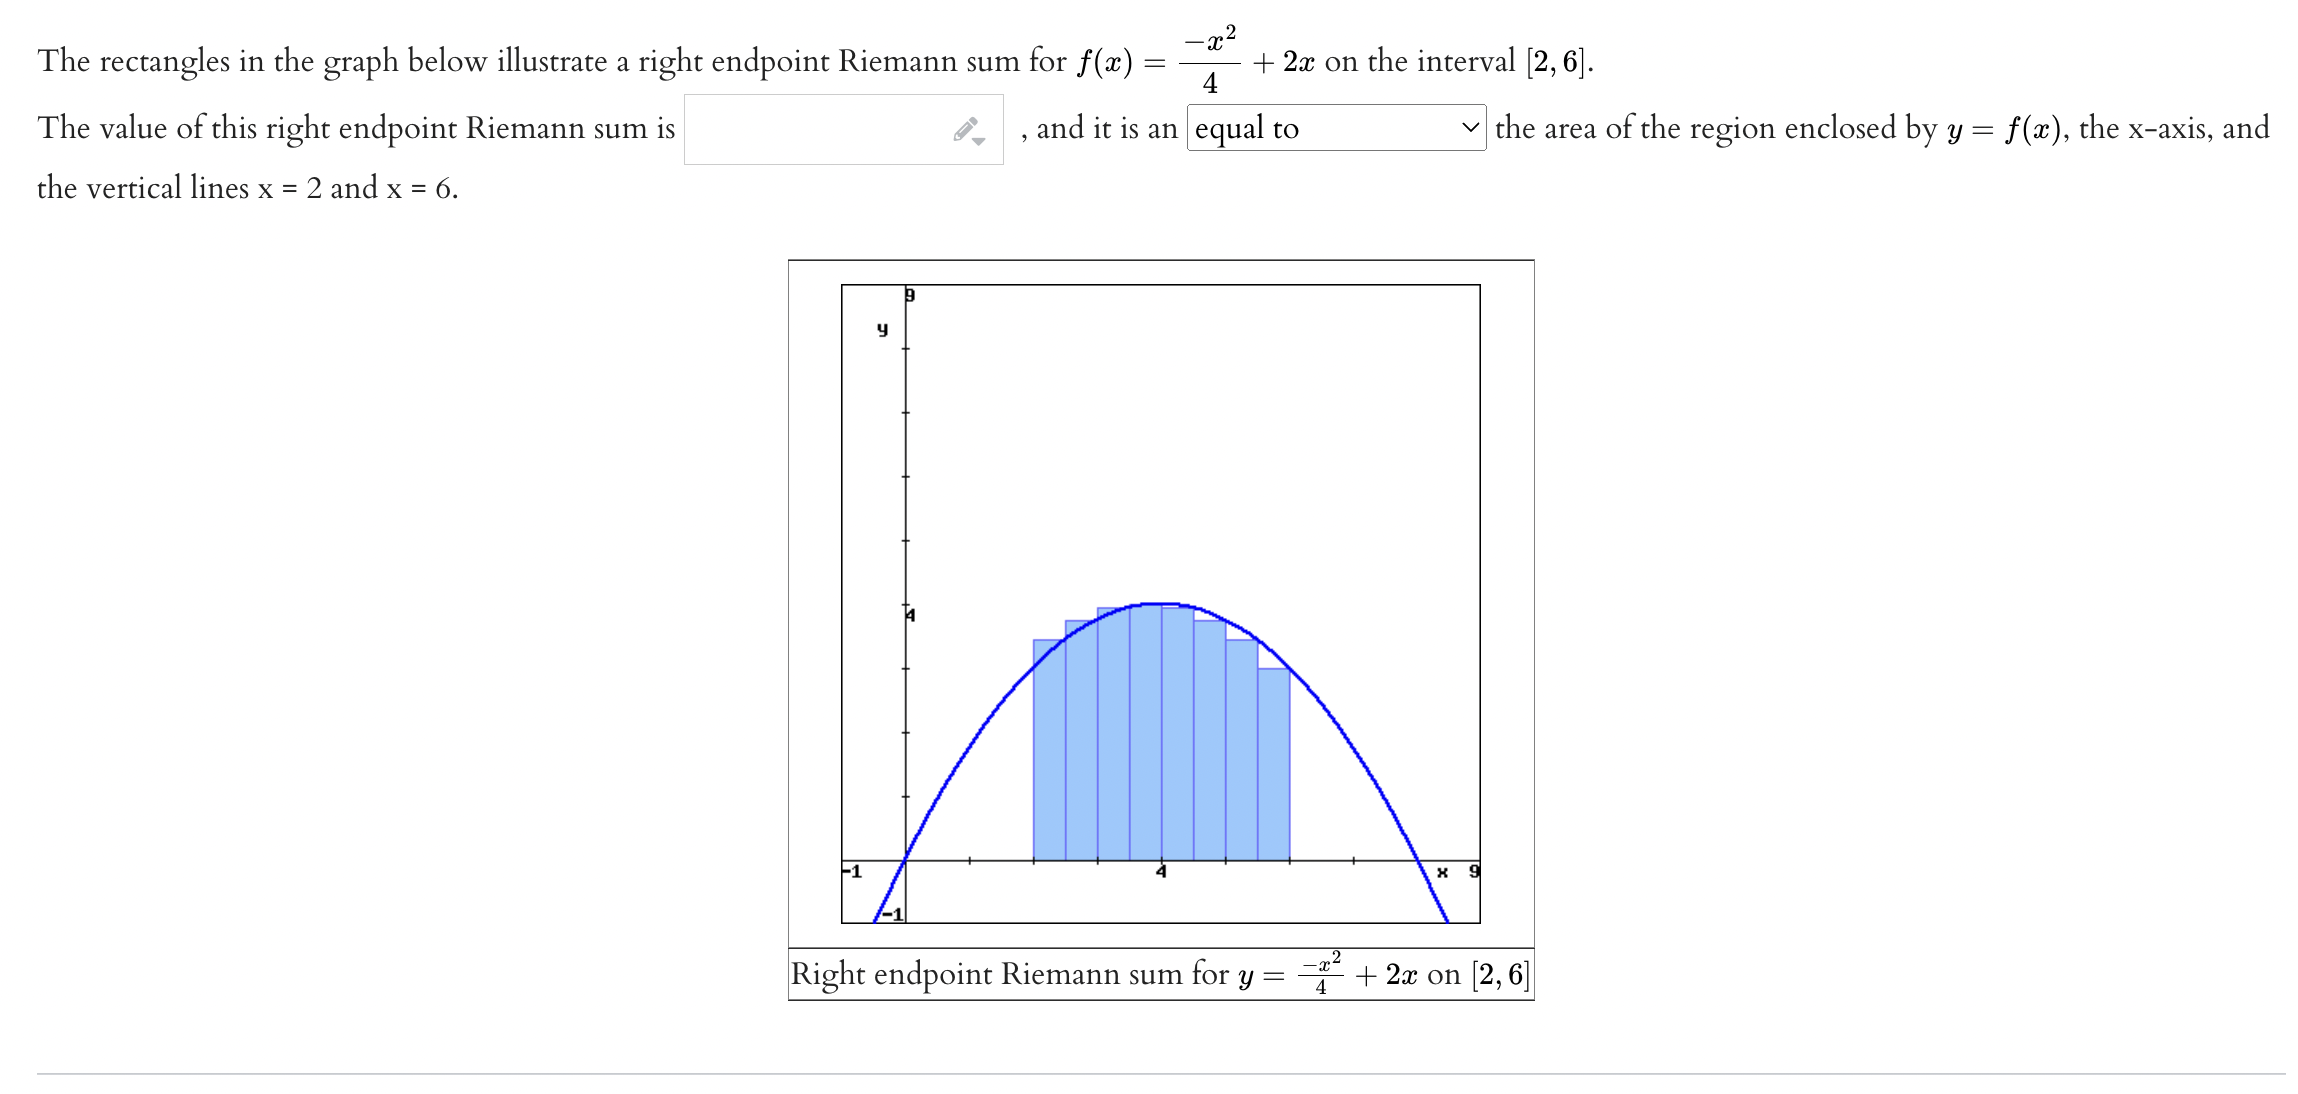
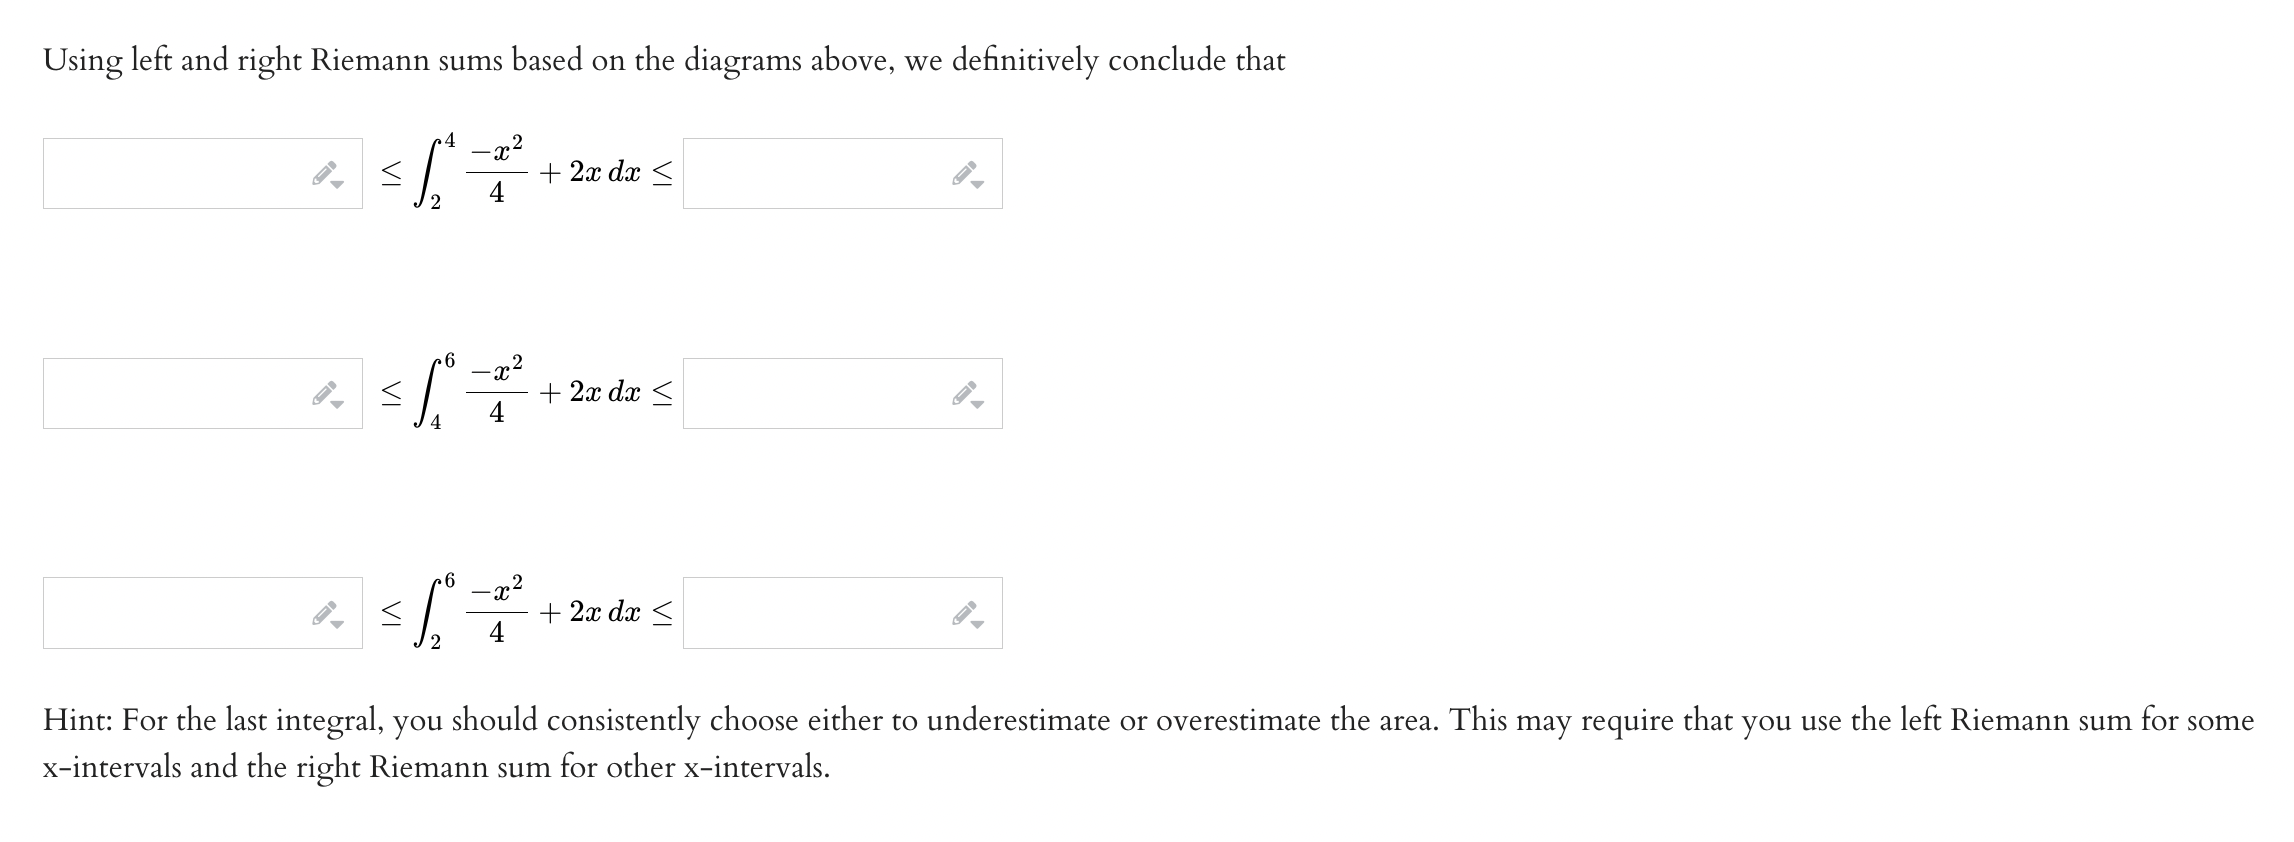
_ 2 The rectangles in the graph below illustrate a left endpoint Riemann sum for f(a:) = Ta: + 2:): on the interval [2, 6]. The value of this left endpoint Riemann sum is I" , and it is the area of the region enclosed by y = at), the xaxis, and the vertical lines x = 2 and x = 6. Left endpoint Riemann sum for y = 'T + 29: on [2, 6] The rectangles in the graph below illustrate a right endpoint Riemann sum for f(a) = -2-2 4 - + 2x on the interval [2, 6]. The value of this right endpoint Riemann sum is , and it is an equal to the area of the region enclosed by y = f(x), the x-axis, and the vertical lines x = 2 and x = 6. Right endpoint Riemann sum for y = -~ + 2x on [2, 6]Using left and right Riemann sums based on the diagrams above, we definitively conclude that 2 2 4 + 2x dx 5 6 - 2-2 4 + 2x dx .2 2 4 + 2x dx Hint: For the last integral, you should consistently choose either to underestimate or overestimate the area. This may require that you use the left Riemann sum for some x-intervals and the right Riemann sum for other x-intervals
Step by Step Solution
There are 3 Steps involved in it

Get step-by-step solutions from verified subject matter experts