

Question: The rectangles in the graph below illustrate a left endpoint Riemann sum for f x on the interval 4 8 9 8 S96 O 7

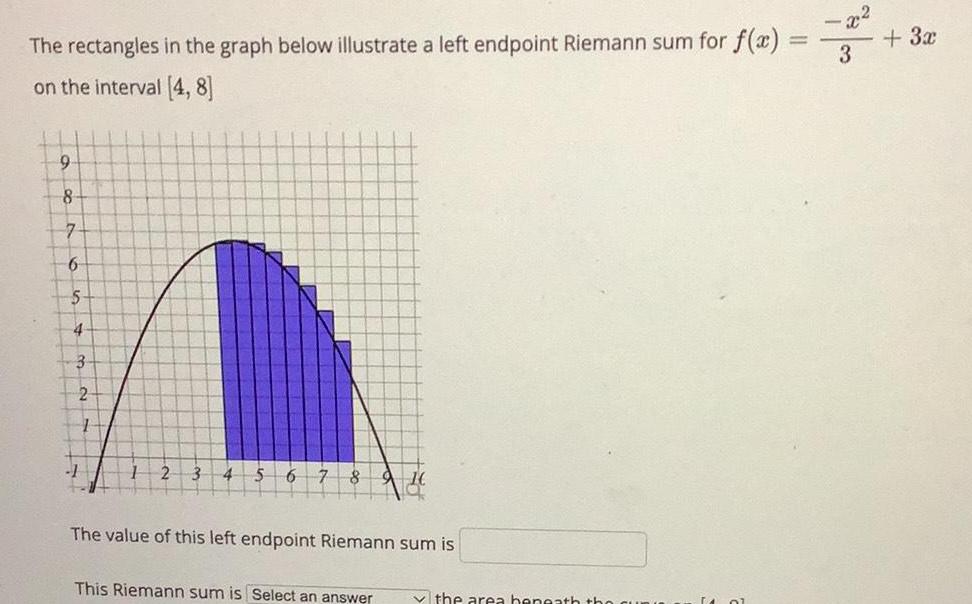
The rectangles in the graph below illustrate a left endpoint Riemann sum for f x on the interval 4 8 9 8 S96 O 7 5 4 3 2 1 3 4 5 6 4 5 6 7 8 10 The value of this left endpoint Riemann sum is This Riemann sum is Select an answer the area beneath the x 3 3x
Step by Step Solution
There are 3 Steps involved in it
1 Expert Approved Answer
Step: 1 Unlock

Question Has Been Solved by an Expert!
Get step-by-step solutions from verified subject matter experts
Step: 2 Unlock
Step: 3 Unlock