

Question: 2. The table below gives the historical return data for Amazon and Exxon-Mobile from the past year. Each indicated return rate is end-of-month to end-of-month
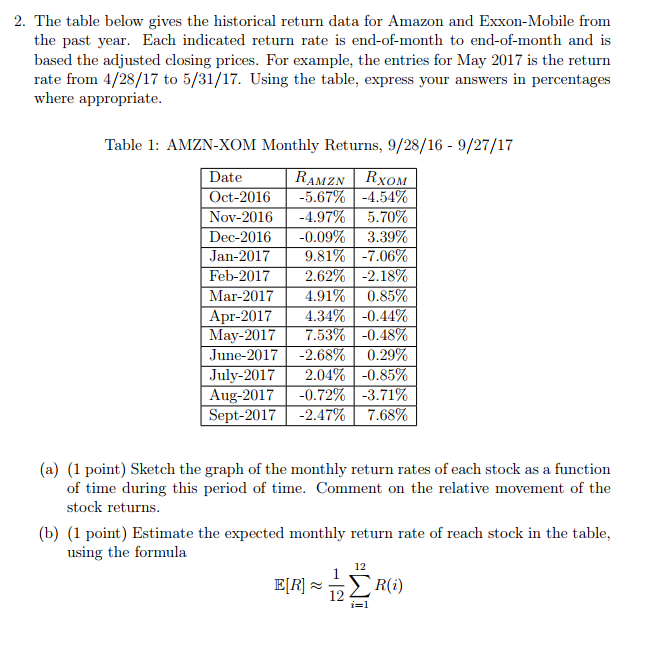
2. The table below gives the historical return data for Amazon and Exxon-Mobile from the past year. Each indicated return rate is end-of-month to end-of-month and is based the adjusted closing prices. For example, the entries for May 2017 is the return rate from 4/28/17 to 5/31/17. Using the table, express your answers in percentages where appropriate Table 1: AMZN-XOM Monthly Returns, 9/28/16 - 9/27/17 Date Oct-2016 | -5.67% -4.54% Nov-2016 | -4.97% | 5.70% Dec-2016 | -0.09% | 3.39% Jan-2017 | 9.81%|-7.06% Feb-2017 | 2.62%|-2.18 Mar-2017 | 4.91%| 0.85% Apr-2017 | 4.34%|-0.44% May-2017| 7.53%|-0.48 June-2017| -2.68%| 0.29 AMZN R XOM Aug-2017 Sept-2017 | | -0.72% -3.71% -2.47%| 7.68% (a) (1 point) Sketch the graph of the monthly return rates of each stock as a function of time during this period of time. Comment on the relative movement of the stock returns (b) (1 point) Estimate the expected monthly return rate of reach stock in the table, using the formula 12 12
Step by Step Solution
There are 3 Steps involved in it

Get step-by-step solutions from verified subject matter experts