

Question: 2. The table below presents the min January daily temperature in Montreal (Canada) in C. Day 1 2 3 4 5 6 7 8
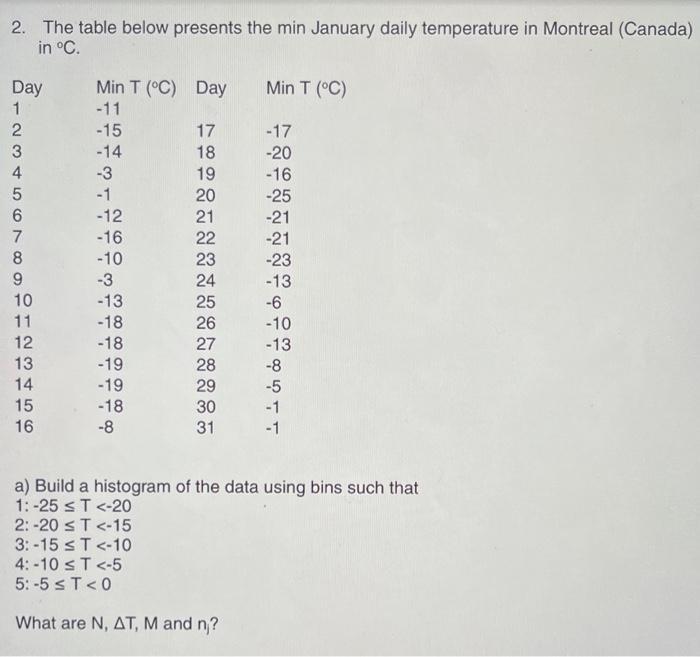

2. The table below presents the min January daily temperature in Montreal (Canada) in C. Day 1 2 3 4 5 6 7 8 9 10 11 12 13 14 15 16 Min T (C) Day -11 -15 -14 -3 -1 -12 -16 -10 -3 -13 -18 -18 -19 -19 -18 -8 17 18 19 20 21 22 23 24 Min T (C) 29 30 31 -17 -20 -16 -25 -21 -21 -23 -13 25 -6 26 -10 27 -13 28 . -8 -5 -1 -1 a) Build a histogram of the data using bins such that 1:-25 T M b) Verify that N = n = n +n + j=1 + n M c) Now let's convert the histogram constructed in a) into a probability density function for the same random variable. Calculate the probability density for each bin (p), where: P = n/(NAT) d) Based on the probability density calculated in c), what is the probability that the January min daily temperature in Montreal lies between -25C T < -20C, i.e. Prob{-25C T < -20}? And what are Prob{-20C T < -15), Prob{-15C T < -10), Prob{-10C T < -5}, Prob{-5C T < 0}? M f) Verify that PAT = 1 /=1 e) Based on the probabilities calculated in d), which temperature range is the most likely?
Step by Step Solution
There are 3 Steps involved in it

Get step-by-step solutions from verified subject matter experts