

Question: 2. The table below shows some nominal exchange rates vs. the USD at the end of 2018 and end of 2019. The table also shows
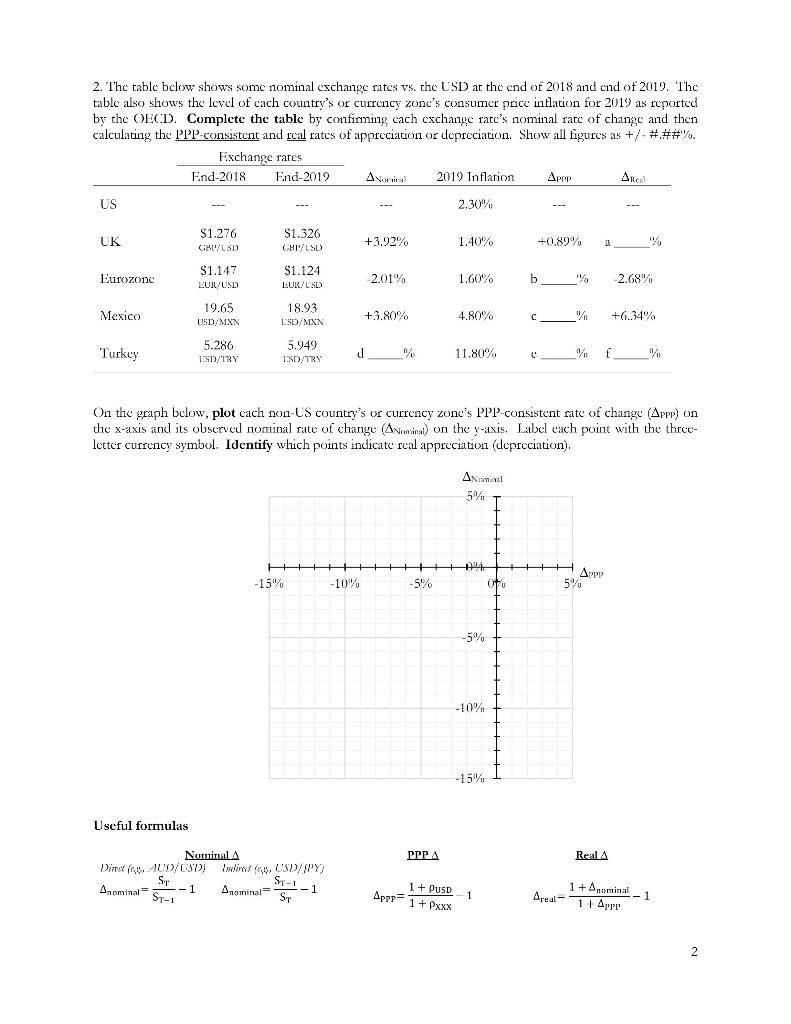
2. The table below shows some nominal exchange rates vs. the USD at the end of 2018 and end of 2019. The table also shows the level of cach country's or currency zone's consumer price inflation for 2019 as reported by the OECD. Complete the table by confirming cach cxchange rates nominal rate of change and then calculating the PPP-consistent and real rates of appreciation or depreciation. Show all figures as +/- ###%. Exchange rates End-2018 End-2019 2019 Inflation Appp Area US 2.30% UK $1.276 CHLUSD $1.326 GBIYLSD +3.92% 1.40% +0.89% 2. Eurozone $1.147 EUR USD $1.124 LUR/LXD -2.01% 1.60% b " -2.68% Mexico 19.65 USD/MXN 18.93 +3.80% 4.80% C +0.34% LSD/MXN Turkey 5.286 USD/TRY 5.949 ISD/TRY d 1/ 11.80% f f % On the graph below, plot cach non-CS country's or currency zone's PPP-consistent rate of change (Appp) on the x-axis and its observed nominal rate of change (Nominal) on the y-axis. Label cach point with the three- letter currency symbol. Identify which points indicate real appreciation (depreciation). AN +44 Ut -15% -10% -5% Appp 5% -5% -10% -15% Useful formulas PPP A Real 4 cala Nominal A Dino ( AUD/USD! ST ST-1 Anominal 1 Anominal= - 1 ST-1 1 + PUSD 1 + Amorainal - 1 Area - 1 Appe ST Appp 1 + xxx 1 2 2. The table below shows some nominal exchange rates vs. the USD at the end of 2018 and end of 2019. The table also shows the level of cach country's or currency zone's consumer price inflation for 2019 as reported by the OECD. Complete the table by confirming cach cxchange rates nominal rate of change and then calculating the PPP-consistent and real rates of appreciation or depreciation. Show all figures as +/- ###%. Exchange rates End-2018 End-2019 2019 Inflation Appp Area US 2.30% UK $1.276 CHLUSD $1.326 GBIYLSD +3.92% 1.40% +0.89% 2. Eurozone $1.147 EUR USD $1.124 LUR/LXD -2.01% 1.60% b " -2.68% Mexico 19.65 USD/MXN 18.93 +3.80% 4.80% C +0.34% LSD/MXN Turkey 5.286 USD/TRY 5.949 ISD/TRY d 1/ 11.80% f f % On the graph below, plot cach non-CS country's or currency zone's PPP-consistent rate of change (Appp) on the x-axis and its observed nominal rate of change (Nominal) on the y-axis. Label cach point with the three- letter currency symbol. Identify which points indicate real appreciation (depreciation). AN +44 Ut -15% -10% -5% Appp 5% -5% -10% -15% Useful formulas PPP A Real 4 cala Nominal A Dino ( AUD/USD! ST ST-1 Anominal 1 Anominal= - 1 ST-1 1 + PUSD 1 + Amorainal - 1 Area - 1 Appe ST Appp 1 + xxx 1 2
Step by Step Solution
There are 3 Steps involved in it

Get step-by-step solutions from verified subject matter experts