

Question: 2. The weighted GPAs for 30 AP Statistics students are shown below. For convenience, the data have been ordered. 3.3 3.5 3.5 3.7 3.76
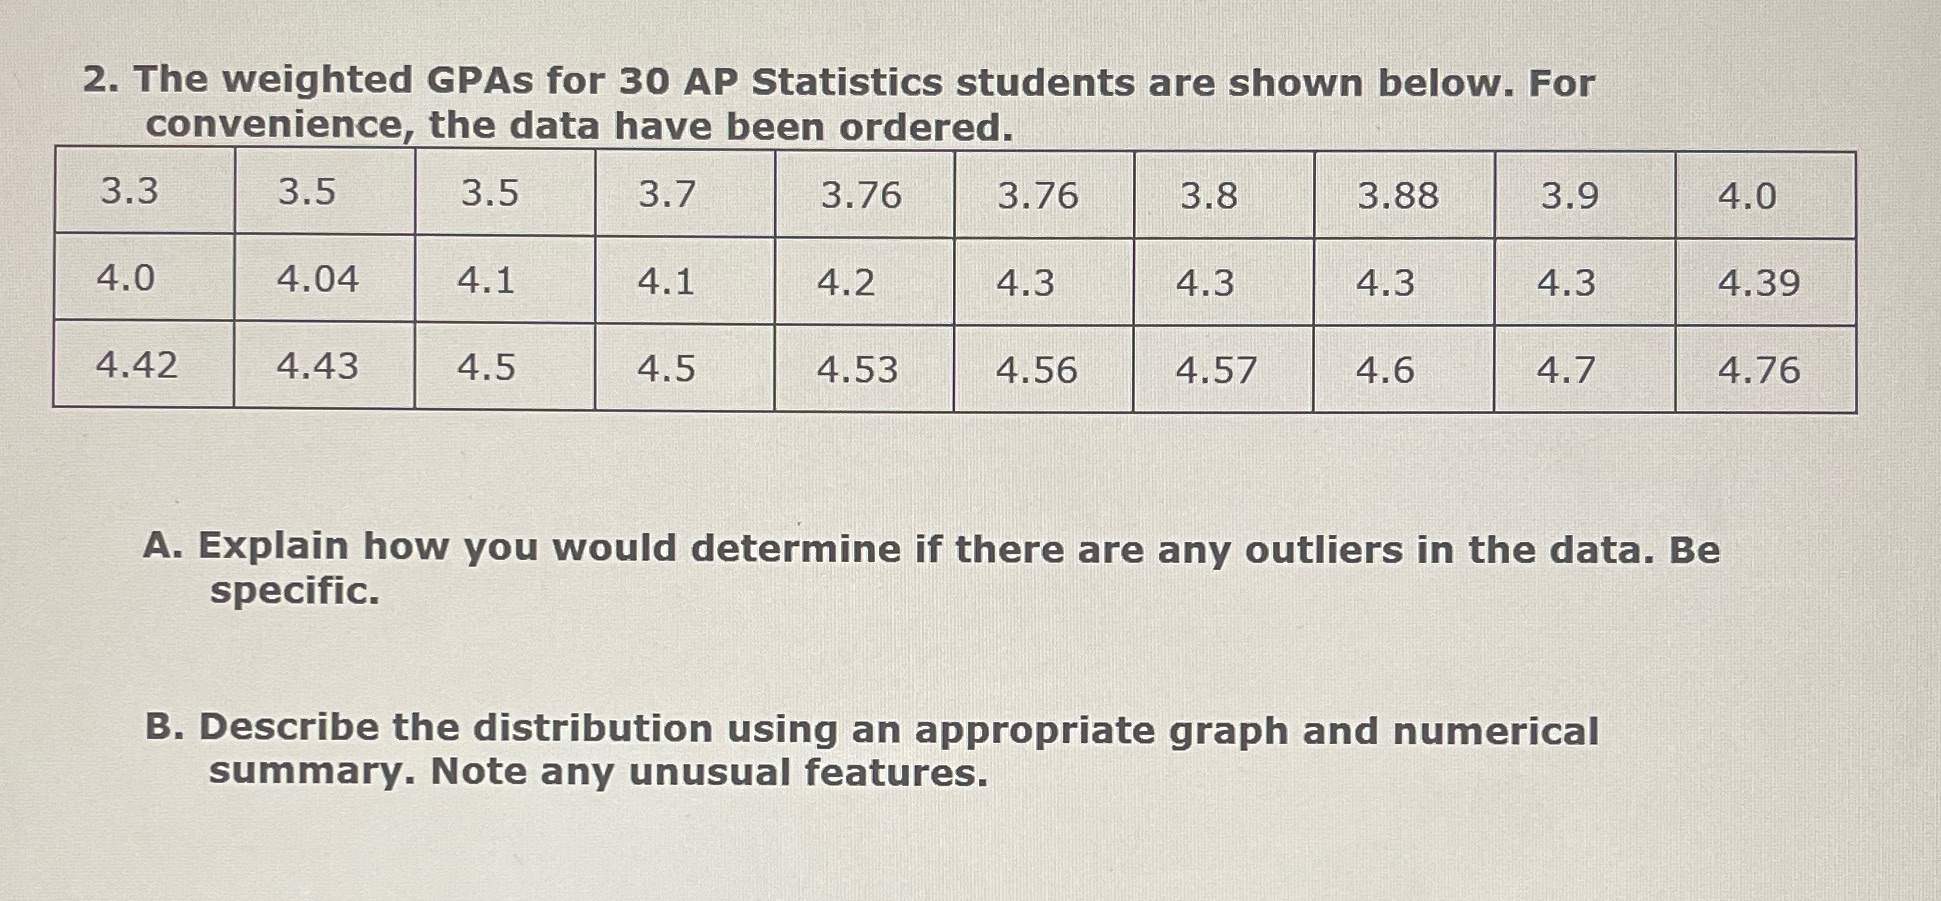
2. The weighted GPAs for 30 AP Statistics students are shown below. For convenience, the data have been ordered. 3.3 3.5 3.5 3.7 3.76 3.76 3.8 3.88 3.9 4.0 4.0 4.04 4.1 4.1 4.2 4.3 4.3 4.3 4.3 4.39 4.42 4.43 4.5 4.5 4.53 4.56 4.57 4.6 4.7 4.76 A. Explain how you would determine if there are any outliers in the data. Be specific. B. Describe the distribution using an appropriate graph and numerical summary. Note any unusual features.
Step by Step Solution
There are 3 Steps involved in it
1 Expert Approved Answer
Step: 1 Unlock

Question Has Been Solved by an Expert!
Get step-by-step solutions from verified subject matter experts
Step: 2 Unlock
Step: 3 Unlock