

Question: 2 This bar graph represents a comparison of school Using information from this graph please answer the following questions 600 500 400 300 200 100
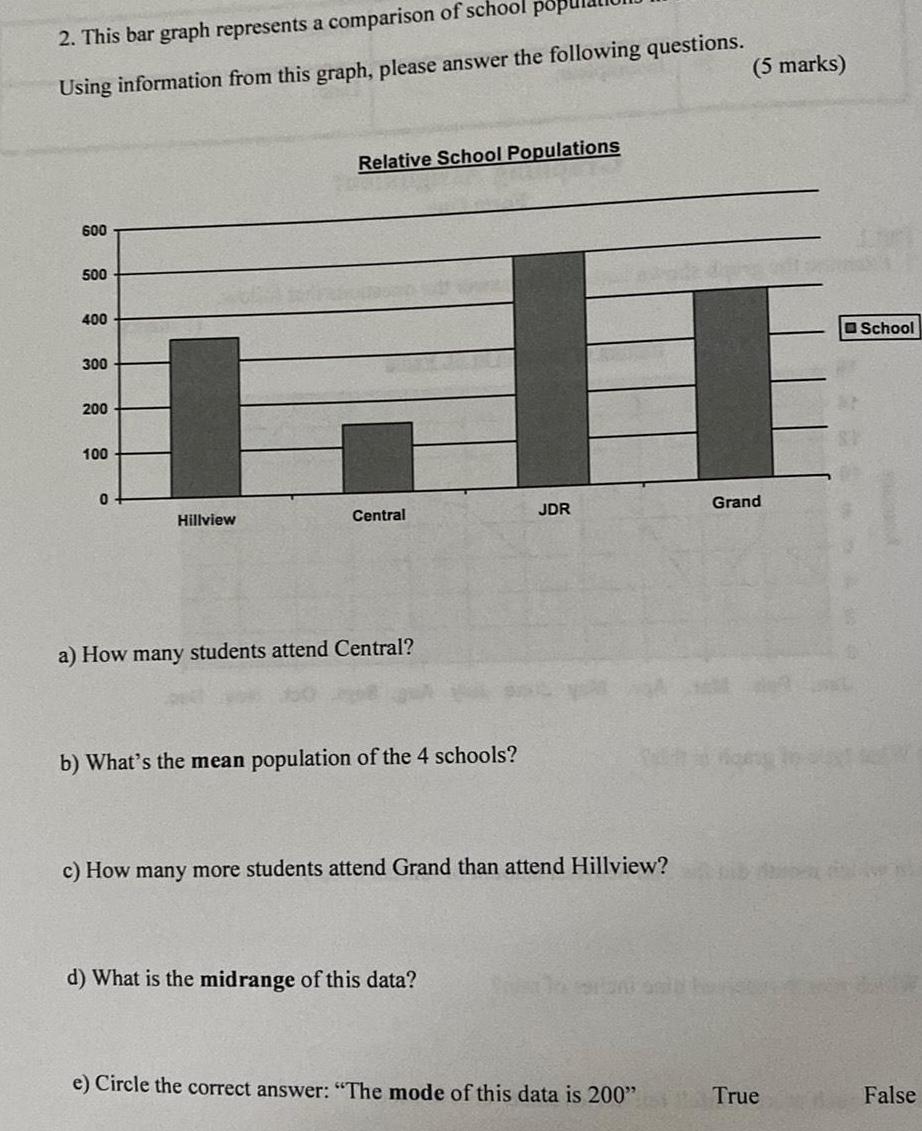

2 This bar graph represents a comparison of school Using information from this graph please answer the following questions 600 500 400 300 200 100 0 Hillview Relative School Populations Central a How many students attend Central b What s the mean population of the 4 schools JDR c How many more students attend Grand than attend Hillview d What is the midrange of this data 5 marks Grand e Circle the correct answer The mode of this data is 200 True School VE False
Step by Step Solution
There are 3 Steps involved in it
1 Expert Approved Answer
Step: 1 Unlock

Question Has Been Solved by an Expert!
Get step-by-step solutions from verified subject matter experts
Step: 2 Unlock
Step: 3 Unlock