

Question: 2. This problem is an extension of problem 2 from homework 2, where you generated realizations from a simple linear model. Here you will be
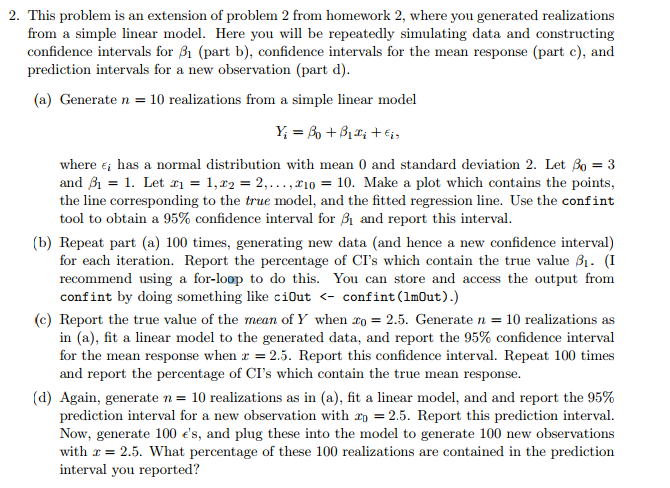
2. This problem is an extension of problem 2 from homework 2, where you generated realizations from a simple linear model. Here you will be repeatedly simulating data and constructing condence intervals for .31 (part b], condence intervals for the mean response {part c], and prediction intervals for a new observation {part cl]. {a} Generate r1 = l realizations from a simple linear model Ti = ) +5113 +Eh where E; has a normal distribution with mean 13 and standard deviation 2. Let 13.; = 3 and ,3; = 1. Let .121 = 1,12 = 2,. .. ,rm = it]. Make a plot which contains the points, the line corresponding to the tree model, and the tted regression line. Use the coniint tool to obtain a 95% condence interval for ,5; and report this interval. [b] Repeat part {a} 100 times, generating new data [and hence a new condence interval] for each iteration. Report the percentage of CI's which contain the true value 31- [I recommend using a for-lo-J to do this. You can store and access. the output from confint by doing something like ciut c coniintilmutL] (c) Report the true value of the mean of 1" when or\" = 2.5. Generate n = l realizations as in {a}, t a linear model to the generated data, and report the 95% condence interval for the mean response when r = 2.5. Report this condence interval. Repeat 1m times and report the percentage of {31's which contain the true mean response. [d] Again, generate n = ll] realizations as in {a}, t a linear model, and and report the 95% prediction interval for a new observation with in. = 2.5. Report this prediction interval. Now, generate ll] c's, and plug thwe into the model to generate lll new observations with z = 2.5. 'What percentage of these ll] realizations are contained in the prediction interval you reported
Step by Step Solution
There are 3 Steps involved in it

Get step-by-step solutions from verified subject matter experts