

Question: 2. Time Value Select the TRUE response 1,800 1000 1,400 1,200 1.000 000 600 400 200 0 5% /-10% -15% C (1+r) Number of
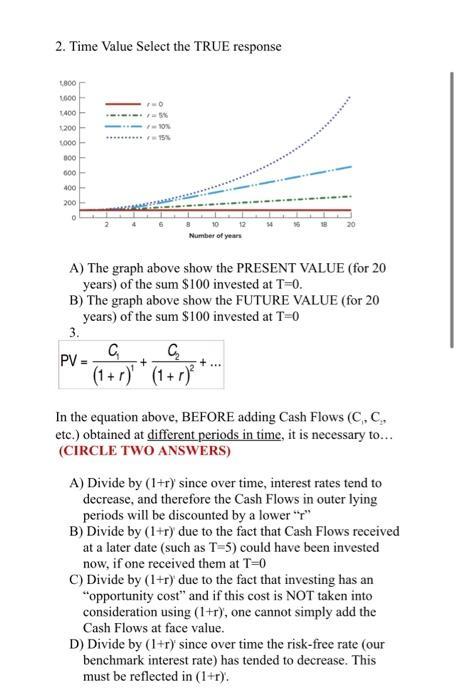
2. Time Value Select the TRUE response 1,800 1000 1,400 1,200 1.000 000 600 400 200 0 5% /-10% -15% C (1+r) Number of years A) The graph above show the PRESENT VALUE (for 20 years) of the sum $100 invested at T=0. B) The graph above show the FUTURE VALUE (for 20 years) of the sum $100 invested at T=0 3. PV = + 18 C (1+r) In the equation above, BEFORE adding Cash Flows (C, C, etc.) obtained at different periods in time, it is necessary to... (CIRCLE TWO ANSWERS) A) Divide by (1+r) since over time, interest rates tend to decrease, and therefore the Cash Flows in outer lying periods will be discounted by a lower "r" B) Divide by (1+r) due to the fact that Cash Flows received at a later date (such as T-5) could have been invested now, if one received them at T-0 C) Divide by (1+r) due to the fact that investing has an "opportunity cost" and if this cost is NOT taken into consideration using (1+r), one cannot simply add the Cash Flows at face value. D) Divide by (1+r) since over time the risk-free rate (our benchmark interest rate) has tended to decrease. This must be reflected in (1+r).
Step by Step Solution
3.37 Rating (153 Votes )
There are 3 Steps involved in it
It seems you have provided an image containing a question about the time value of money along with a graph and some multiplechoice questions The graph in the image is not labeled with specific details ... View full answer

Get step-by-step solutions from verified subject matter experts