

Question: 2 Transportation problems can be easily visualized as a network where the nodes in the graph are locations and the arrows 3 represent potential shipments
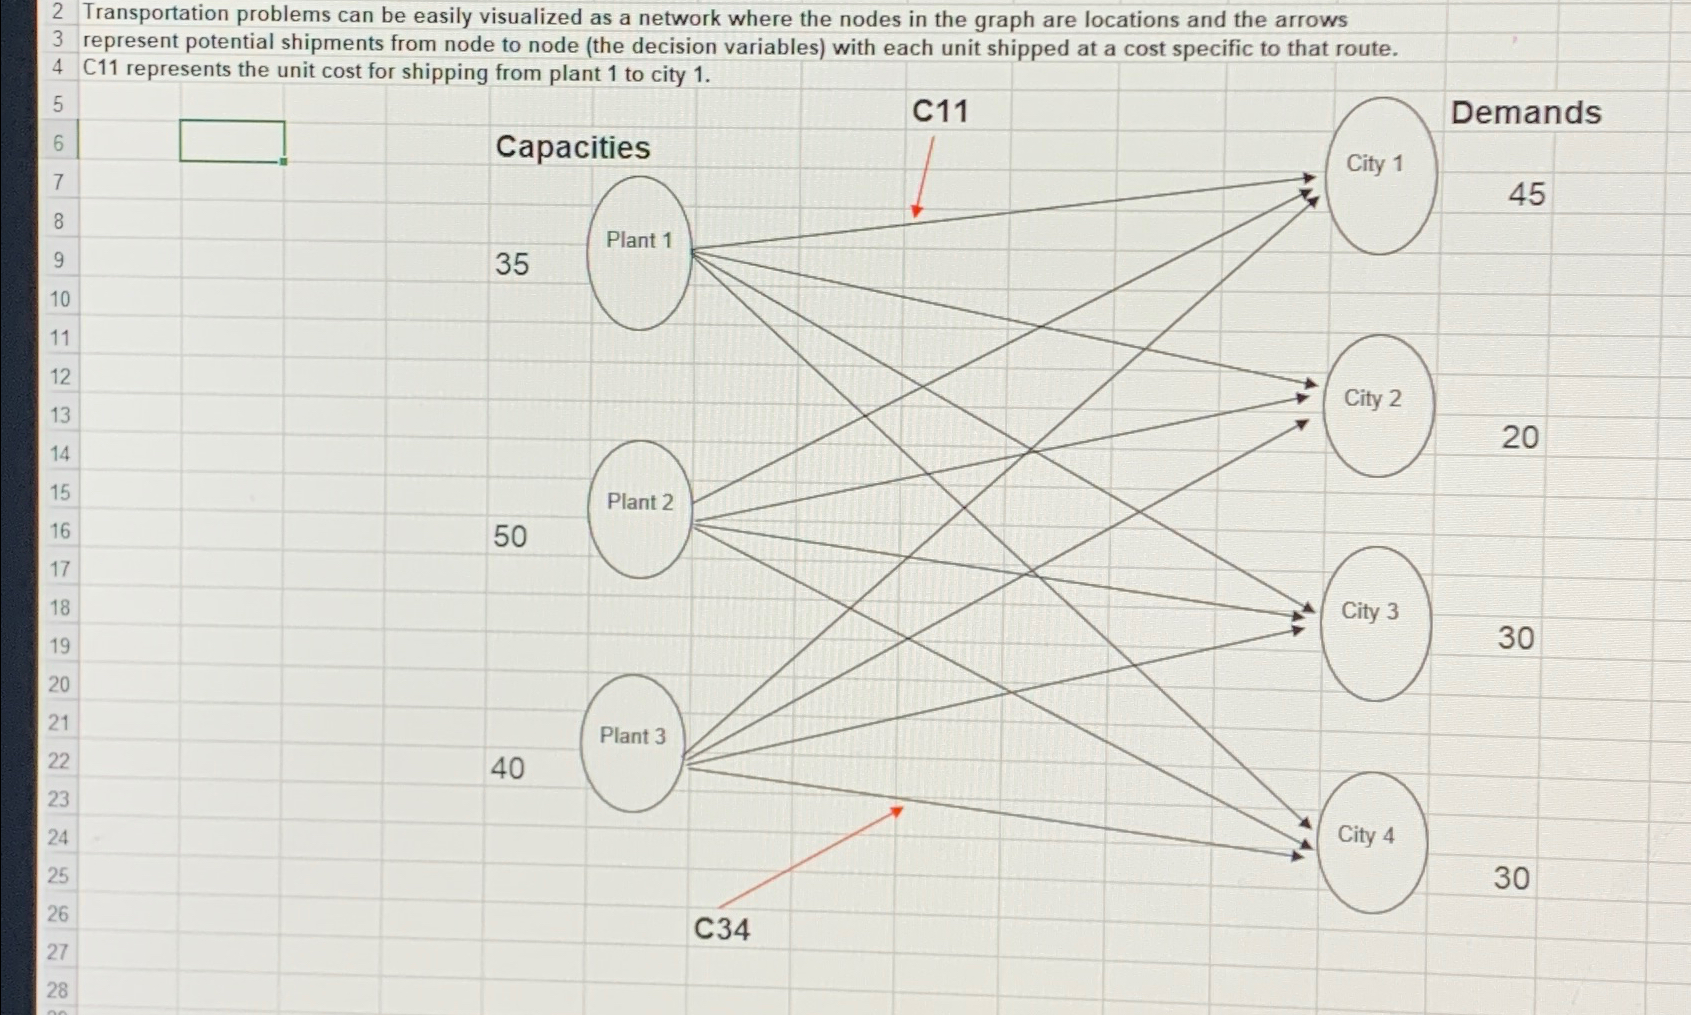
Transportation problems can be easily visualized as a network where the nodes in the graph are locations and the arrows
represent potential shipments from node to node the decision variables with each unit shipped at a cost specific to that route.
C represents the unit cost for shipping from plant to city
Step by Step Solution
There are 3 Steps involved in it
1 Expert Approved Answer
Step: 1 Unlock

Question Has Been Solved by an Expert!
Get step-by-step solutions from verified subject matter experts
Step: 2 Unlock
Step: 3 Unlock