

Question: 2. Use a table of values to graph the function f(x)=x. Choose the correct graph from the options below. A. 10 9 8 7

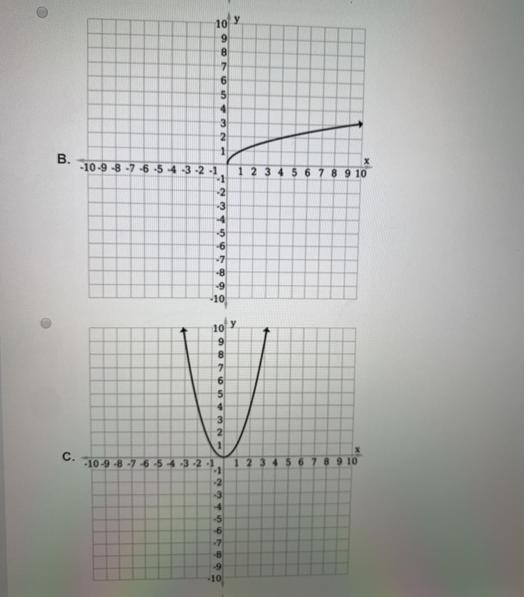
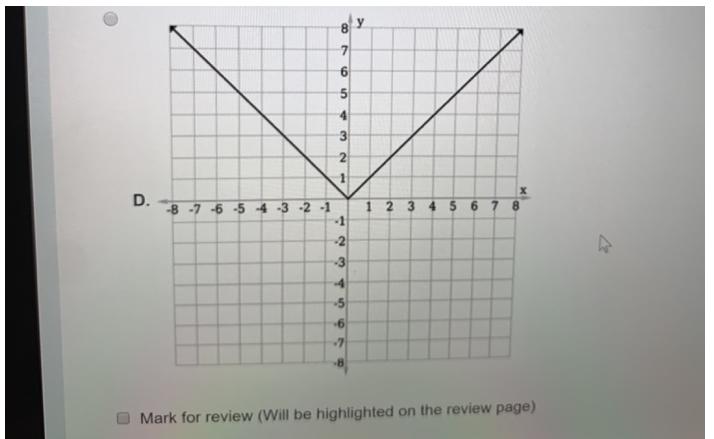
2. Use a table of values to graph the function f(x)=x. Choose the correct graph from the options below. A. 10 9 8 7 6 5 4 3 -NW 1 -10-9-8-7-6-5-4-3-2-1 e m 2 3 4 +5 -6 2 -8 -9 -10 y *O 1 2 3 4 5 6 7 8 9 10 O B. C. 9 8 7 9 5 1326 -10-9-8-7-6-5-4-3-2-1 1234 -1 -2 -3 -6 -7 9 -8 6 10 10 y 9 8 L 654321 -10-9-8-7-6-54-3-2-1 123456 -1 -2 -3 4 -5 -6 -7 -8 9 -10 6 7 8 9 10 8 9 10 D. -8-7-6-5 4 -3 -2 -1 7 6 5 4 43 2 1 1 -2 in & Wi -3 -5 1 2 3 4 5 6 7 8 Mark for review (Will be highlighted on the review page) 27
Step by Step Solution
3.48 Rating (161 Votes )
There are 3 Steps involved in it
The detailed ... View full answer

Get step-by-step solutions from verified subject matter experts