

Question: 2. Use the Excel file Data for Two Stocks to determine the following: a. Create a two-way data table that determines the standard deviations for

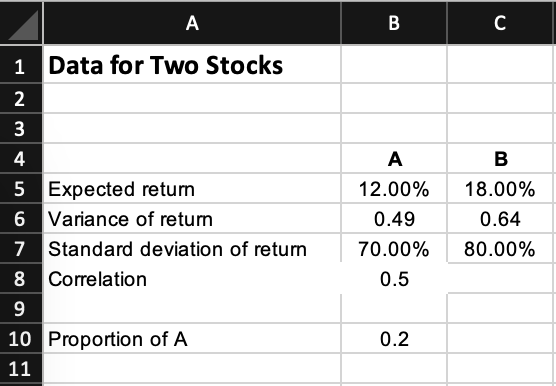
2. Use the Excel file Data for Two Stocks to determine the following: a. Create a two-way data table that determines the standard deviations for portfolios consisting of combinations of Stock A and Stock B by varying the correlation coefficient value between Stock A and Stock B through the full range of possible correlation coefficient values. Use increments of 0.50 for the possible correlation coefficient values. Vary the proportion invested in Stock A from 0 to 1.00 in increments of 0.20. A B C 1 Data for Two Stocks N A 3 4 5 Expected return 6 Variance of retum 7 Standard deviation of return 8 Correlation 9 10 Proportion of A 11 12.00% 0.49 70.00% 0.5 B 18.00% 0.64 80.00% 0.2 2. Use the Excel file Data for Two Stocks to determine the following: a. Create a two-way data table that determines the standard deviations for portfolios consisting of combinations of Stock A and Stock B by varying the correlation coefficient value between Stock A and Stock B through the full range of possible correlation coefficient values. Use increments of 0.50 for the possible correlation coefficient values. Vary the proportion invested in Stock A from 0 to 1.00 in increments of 0.20. A B C 1 Data for Two Stocks N A 3 4 5 Expected return 6 Variance of retum 7 Standard deviation of return 8 Correlation 9 10 Proportion of A 11 12.00% 0.49 70.00% 0.5 B 18.00% 0.64 80.00% 0.2
Step by Step Solution
There are 3 Steps involved in it

Get step-by-step solutions from verified subject matter experts