

Question: 2. Use the Excel file Data for Two Stocks to determine the following: a. Create a two-way data table that determines the standard deviations for
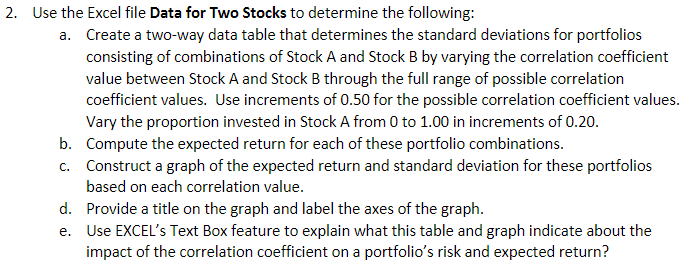
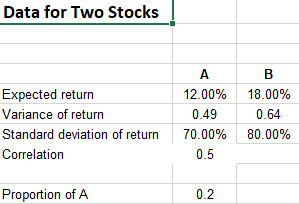
2. Use the Excel file Data for Two Stocks to determine the following: a. Create a two-way data table that determines the standard deviations for portfolios consisting of combinations of Stock A and Stock B by varying the correlation coefficient value between Stock A and Stock B through the full range of possible correlation coefficient values. Use increments of 0.50 for the possible correlation coefficient values. Vary the proportion invested in Stock A from 0 to 1.00 in increments of 0.20. b. Compute the expected return for each of these portfolio combinations. C. Construct a graph of the expected return and standard deviation for these portfolios based on each correlation value. d. Provide a title on the graph and label the axes of the graph. e. Use EXCEL's Text Box feature to explain what this table and graph indicate about the impact of the correlation coefficient on a portfolio's risk and expected return? Data for Two Stocks Expected return Variance of return Standard deviation of return Correlation A 12.00% 0.49 70.00% 0.5 B 18.00% 0.64 80.00% Proportion of A 0.2 2. Use the Excel file Data for Two Stocks to determine the following: a. Create a two-way data table that determines the standard deviations for portfolios consisting of combinations of Stock A and Stock B by varying the correlation coefficient value between Stock A and Stock B through the full range of possible correlation coefficient values. Use increments of 0.50 for the possible correlation coefficient values. Vary the proportion invested in Stock A from 0 to 1.00 in increments of 0.20. b. Compute the expected return for each of these portfolio combinations. C. Construct a graph of the expected return and standard deviation for these portfolios based on each correlation value. d. Provide a title on the graph and label the axes of the graph. e. Use EXCEL's Text Box feature to explain what this table and graph indicate about the impact of the correlation coefficient on a portfolio's risk and expected return? Data for Two Stocks Expected return Variance of return Standard deviation of return Correlation A 12.00% 0.49 70.00% 0.5 B 18.00% 0.64 80.00% Proportion of A 0.2
Step by Step Solution
There are 3 Steps involved in it

Get step-by-step solutions from verified subject matter experts