

Question: 2. Use the following information to construct a Gantt chart in MS Project. a) What is the expected duration of the project? (3) b)
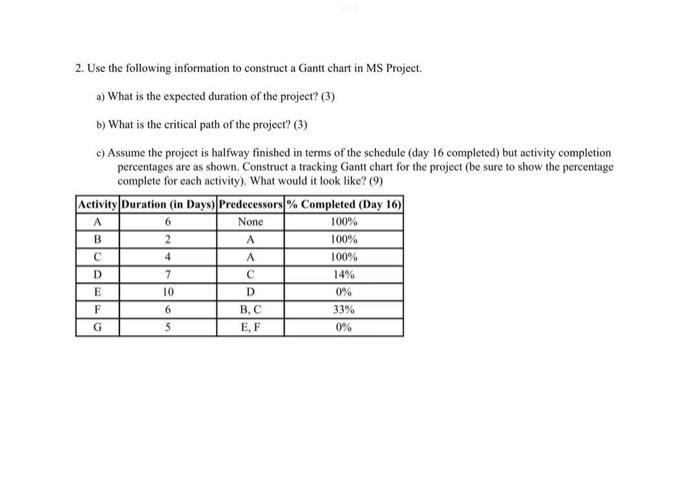
2. Use the following information to construct a Gantt chart in MS Project. a) What is the expected duration of the project? (3) b) What is the critical path of the project? (3) e) Assume the project is halfway finished in terms of the schedule (day 16 completed) but activity completion percentages are as shown. Construct a tracking Gantt chart for the project (be sure to show the percentage complete for each activity). What would it look like? (9) Activity Duration (in Days) Predecessors % Completed (Day 16) A 6 None 100% B 2 A 100% C 4 A 100% D 7 C 14% E 10 D 0% F 6 B, C 33% G 5 E, F 0%
Step by Step Solution
There are 3 Steps involved in it

Get step-by-step solutions from verified subject matter experts