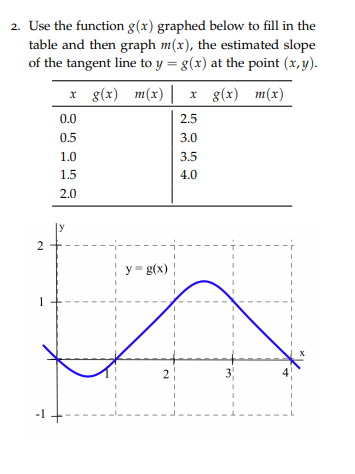
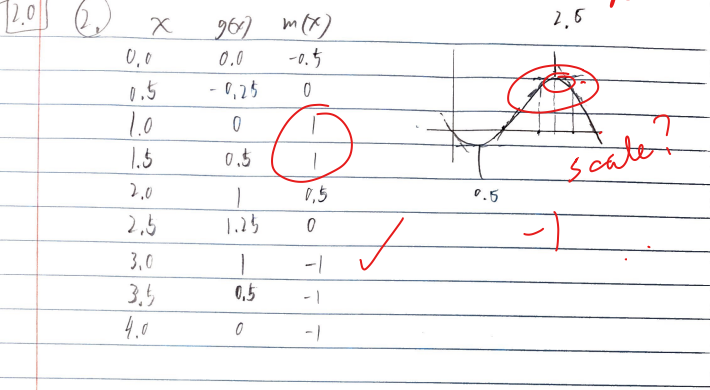
Question: 2. Use the function g(x) graphed below to fill in the table and then graph m(x), the estimated slope of the tangent line to y

2. Use the function g(x) graphed below to fill in2. Use the function g(x) graphed below to fill in
2. Use the function g(x) graphed below to fill in the table and then graph m(x), the estimated slope of the tangent line to y = g(x) at the point (x, y). x g(x) m(x) x g(x) m(x) 0.0 2.5 0.5 3.0 1.0 3.5 1.5 4.0 2.0 2 - = yg(x) -1 -- -=\f

Step by Step Solution

There are 3 Steps involved in it

1 Expert Approved Answer
Step: 1 Unlock blur-text-image
Question Has Been Solved by an Expert!

Get step-by-step solutions from verified subject matter experts

Step: 2 Unlock
Step: 3 Unlock

Students Have Also Explored These Related Mathematics Questions!