

Question: 2. Use the operating projections for each project to compute net present value (NPV) for each. Which project creates more value? (Ensure you attach spreadsheet
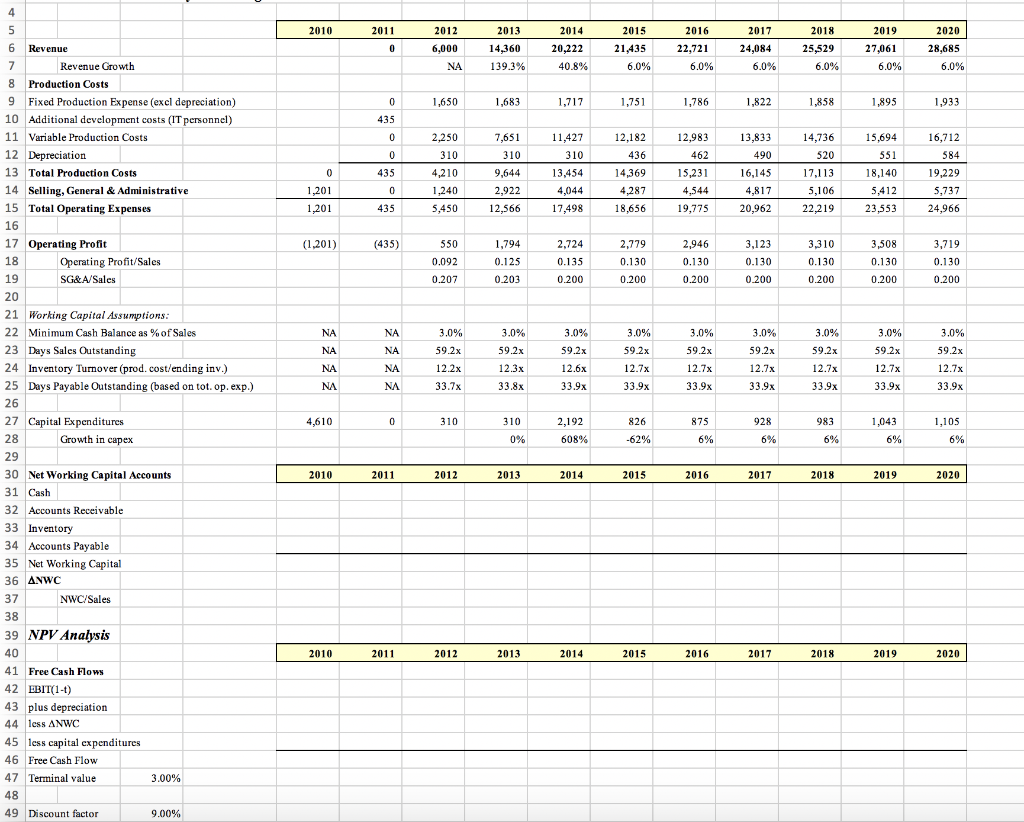
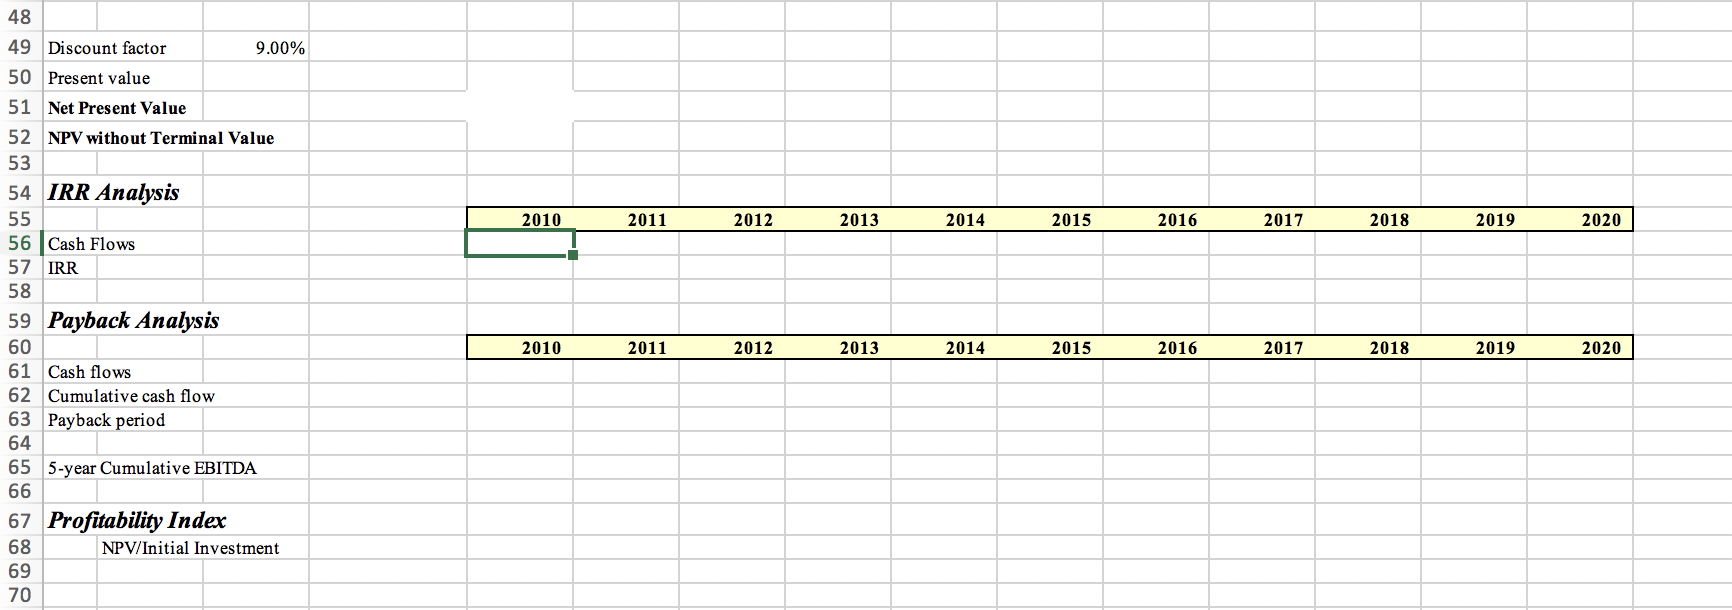
2. Use the operating projections for each project to compute net present value (NPV) for each. Which project creates more value? (Ensure you attach spreadsheet of calculations) (25 Points) 3. Compute the internal rate of return (IRR) and payback period for each project. How should these metrics affect Harris's deliberations? How do they compare to NPV as tools for evaluating projects? When and how would you use each? (Ensure you attach spreadsheet of calculations) (25 Points) 2010 2011 2012 2014 2015 2016 2017 2020 0 6,000 NA 2013 14,360 139.3% 20,222 40.8% 21,435 6.0% 22,721 6.0% 24,084 6.0% 2018 25,529 6.0% 2019 27,061 6.0% 28,685 6.0% 0 1,650 1,683 1,717 1,751 1,786 1,822 1,858 1,895 1,933 435 0 7,651 310 11,427 310 12,182 436 12,983 462 0 2,250 310 4,210 1,240 13,833 490 16,145 4,817 435 0 1,201 1,201 9,644 2,922 13,454 4,044 14,369 4,287 15,231 4,544 14,736 520 17,113 5,106 22,219 15,694 551 18,140 5,412 23,553 16,712 584 19,229 5,737 24,966 0 435 5,450 12,566 17,498 18,656 19,775 20,962 (1,201) (435) 1,794 550 0.092 2,724 0.135 0.200 2,779 0.130 0.200 2,946 0.130 0.125 0.203 3,123 0.130 0.200 3,310 0.130 0.200 3,508 0.130 3,719 0.130 0.200 0.207 0.200 0.200 NA NA 3.0% 59.2x 3.0% 59.2x 3.0% 59.2x 3.0% 59.2x 3.0% 59.2x 3.0% 59.2x 3.0% 59.2x 3.0% 59.2x NA NA 3.0% 59.2x 12.7x 33.9x NA NA 12.2x 12.3x 33.8x 12.6x 33.9x 12.7x 33.9x 12.7x 33.9x 12.7x 33.9x 12.7x 33.9x 12.7x 33.9x NA NA 33.7% 4 5 6 6 Revenue 7 Revenue Growth 8 Production Costs 9 Fixed Production Expense (excl depreciation) 10 Additional development costs (IT personnel) 11 Variable Production Costs 12 Depreciation 13 Total Production Costs 14 Selling, General & Administrative 15 Total Operating Expenses 16 17 Operating Profit 18 Operating Profit/Sales 19 SG&A/Sales & 20 21 Working Capital Assumptions: 22 Minimum Cash Balance as %of Sales 23 Days Sales Outstanding 24 Inventory Tumover (prod. cost/ending inv.) 25 Days Payable Outstanding (based on tot. op. exp.) 26 27 Capital Expenditures 28 Growth in capex 29 30 Net Working Capital Accounts 31 Cash 32 Accounts Receivable 33 Inventory 34 Accounts Payable 35 Net Working Capital 36 ANWC 37 NWC/Sales 38 39 NPV Analysis 40 41 Free Cash Flows 42 EBIT(1-1) 43 plus depreciation 44 less ANWC 45 less capital expenditures 46 Free Cash Flow 47 Terminal value 3.00% 48 49 Discount factor 9.00% 4,610 0 0 310 310 2,192 826 875 928 983 1,043 6% 1,105 6% 0% 608% -62% 6% 6% 6% 2010 2011 2012 2013 2014 2015 2016 2017 2018 2019 2020 2010 2011 2012 2013 2014 2015 2016 2017 2018 2019 2020 2010 2011 2012 2013 2014 2015 2016 2017 2018 2019 2020 48 49 Discount factor 9.00% 50 Present value 51 Net Present Value 52 NPV without Terminal Value 53 54 IRR Analysis 55 56 Cash Flows 57 IRR 58 59 Payback Analysis 60 61 Cash flows 62 Cumulative cash flow 63 Payback period 64 65 5-year Cumulative EBITDA 66 67 Profitability Index 68 NPV/Initial Investment 69 70 2010 2011 2012 2013 2014 2015 2016 2017 2018 2019 2020 2. Use the operating projections for each project to compute net present value (NPV) for each. Which project creates more value? (Ensure you attach spreadsheet of calculations) (25 Points) 3. Compute the internal rate of return (IRR) and payback period for each project. How should these metrics affect Harris's deliberations? How do they compare to NPV as tools for evaluating projects? When and how would you use each? (Ensure you attach spreadsheet of calculations) (25 Points) 2010 2011 2012 2014 2015 2016 2017 2020 0 6,000 NA 2013 14,360 139.3% 20,222 40.8% 21,435 6.0% 22,721 6.0% 24,084 6.0% 2018 25,529 6.0% 2019 27,061 6.0% 28,685 6.0% 0 1,650 1,683 1,717 1,751 1,786 1,822 1,858 1,895 1,933 435 0 7,651 310 11,427 310 12,182 436 12,983 462 0 2,250 310 4,210 1,240 13,833 490 16,145 4,817 435 0 1,201 1,201 9,644 2,922 13,454 4,044 14,369 4,287 15,231 4,544 14,736 520 17,113 5,106 22,219 15,694 551 18,140 5,412 23,553 16,712 584 19,229 5,737 24,966 0 435 5,450 12,566 17,498 18,656 19,775 20,962 (1,201) (435) 1,794 550 0.092 2,724 0.135 0.200 2,779 0.130 0.200 2,946 0.130 0.125 0.203 3,123 0.130 0.200 3,310 0.130 0.200 3,508 0.130 3,719 0.130 0.200 0.207 0.200 0.200 NA NA 3.0% 59.2x 3.0% 59.2x 3.0% 59.2x 3.0% 59.2x 3.0% 59.2x 3.0% 59.2x 3.0% 59.2x 3.0% 59.2x NA NA 3.0% 59.2x 12.7x 33.9x NA NA 12.2x 12.3x 33.8x 12.6x 33.9x 12.7x 33.9x 12.7x 33.9x 12.7x 33.9x 12.7x 33.9x 12.7x 33.9x NA NA 33.7% 4 5 6 6 Revenue 7 Revenue Growth 8 Production Costs 9 Fixed Production Expense (excl depreciation) 10 Additional development costs (IT personnel) 11 Variable Production Costs 12 Depreciation 13 Total Production Costs 14 Selling, General & Administrative 15 Total Operating Expenses 16 17 Operating Profit 18 Operating Profit/Sales 19 SG&A/Sales & 20 21 Working Capital Assumptions: 22 Minimum Cash Balance as %of Sales 23 Days Sales Outstanding 24 Inventory Tumover (prod. cost/ending inv.) 25 Days Payable Outstanding (based on tot. op. exp.) 26 27 Capital Expenditures 28 Growth in capex 29 30 Net Working Capital Accounts 31 Cash 32 Accounts Receivable 33 Inventory 34 Accounts Payable 35 Net Working Capital 36 ANWC 37 NWC/Sales 38 39 NPV Analysis 40 41 Free Cash Flows 42 EBIT(1-1) 43 plus depreciation 44 less ANWC 45 less capital expenditures 46 Free Cash Flow 47 Terminal value 3.00% 48 49 Discount factor 9.00% 4,610 0 0 310 310 2,192 826 875 928 983 1,043 6% 1,105 6% 0% 608% -62% 6% 6% 6% 2010 2011 2012 2013 2014 2015 2016 2017 2018 2019 2020 2010 2011 2012 2013 2014 2015 2016 2017 2018 2019 2020 2010 2011 2012 2013 2014 2015 2016 2017 2018 2019 2020 48 49 Discount factor 9.00% 50 Present value 51 Net Present Value 52 NPV without Terminal Value 53 54 IRR Analysis 55 56 Cash Flows 57 IRR 58 59 Payback Analysis 60 61 Cash flows 62 Cumulative cash flow 63 Payback period 64 65 5-year Cumulative EBITDA 66 67 Profitability Index 68 NPV/Initial Investment 69 70 2010 2011 2012 2013 2014 2015 2016 2017 2018 2019 2020
Step by Step Solution
There are 3 Steps involved in it

Get step-by-step solutions from verified subject matter experts