

Question: 2) Use the semi-annually compounded yield curve below, price the following securities: a) Plot the zero/spot/yield curve. b) 5-year zero coupon bond c) 7-year coupon
2) Use the semi-annually compounded yield curve below, price the following securities:
a) Plot the zero/spot/yield curve. b) 5-year zero coupon bond c) 7-year coupon bond paying 15% semiannually d) 4-year coupon bond paying 7% quarterly e) 3 14-year coupon bond paying 9% semiannually
3) Use the same yield curve in 2). Consider two bonds, both with 7 years to maturity, but with different coupon rates. Let the two coupon rates be 15% and 3%.
a) Compute the prices and the yields to maturity of these coupon bonds. b) How do the yields to maturity compare to each other? If they are different, why are they different? Would the difference in yields imply that one is a better buy than the other?
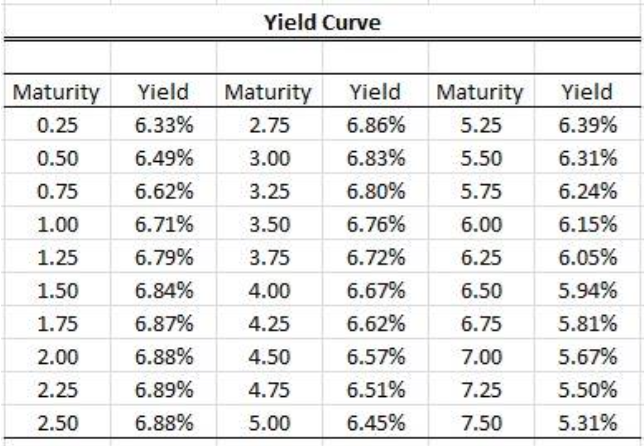
Yield Curve MaturityYieldMaturity Yield Maturity Yield 0.25 6.33% 275 6.86% 525 6.39% 0.50 6.49% 3.00 6.83% 5.50 6.31% 0.75 6.62% 3.25 6.80% 5.75 6.24% 1.00 6.71% 3.50 6.76% 6.00 6.15% 1.25 6.79% 3.75 6.72% 6.25 6.05% 1.50 6.84% 4.00 6.67% 6.50 5.94% 1.75 6.87% 4.25 6.62% 6.75 5.81% 2.00 6.88% 4.50 6.57% 7.00 5.67% 225 6.89% 475 6.51% 725 5.50% 2.50 6.88% 5.00 6.45% 7.50 5.31%
Step by Step Solution
There are 3 Steps involved in it

Get step-by-step solutions from verified subject matter experts