

Question: 2. Using the equation dtdn=C0tD and the data shown in the following table, plot the number of molecules of albumin, IgG, and fibrinogen adsorbed on
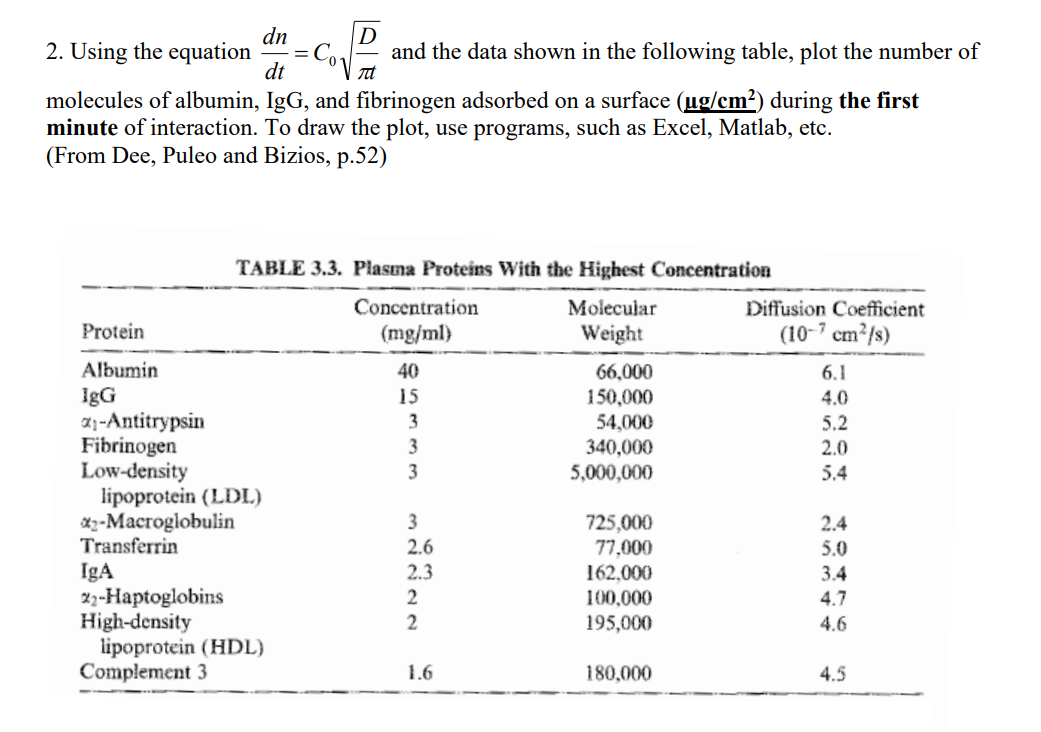
2. Using the equation dtdn=C0tD and the data shown in the following table, plot the number of molecules of albumin, IgG, and fibrinogen adsorbed on a surface (ug/cm2) during the first minute of interaction. To draw the plot, use programs, such as Excel, Matlab, etc. (From Dee, Puleo and Bizios, p.52)
Step by Step Solution
There are 3 Steps involved in it
1 Expert Approved Answer
Step: 1 Unlock

Question Has Been Solved by an Expert!
Get step-by-step solutions from verified subject matter experts
Step: 2 Unlock
Step: 3 Unlock