

Question: 2. Using the estimated regression model from the above result, calculate the respective predicted PBV multiples and fill in the blanks (Note: Round to the

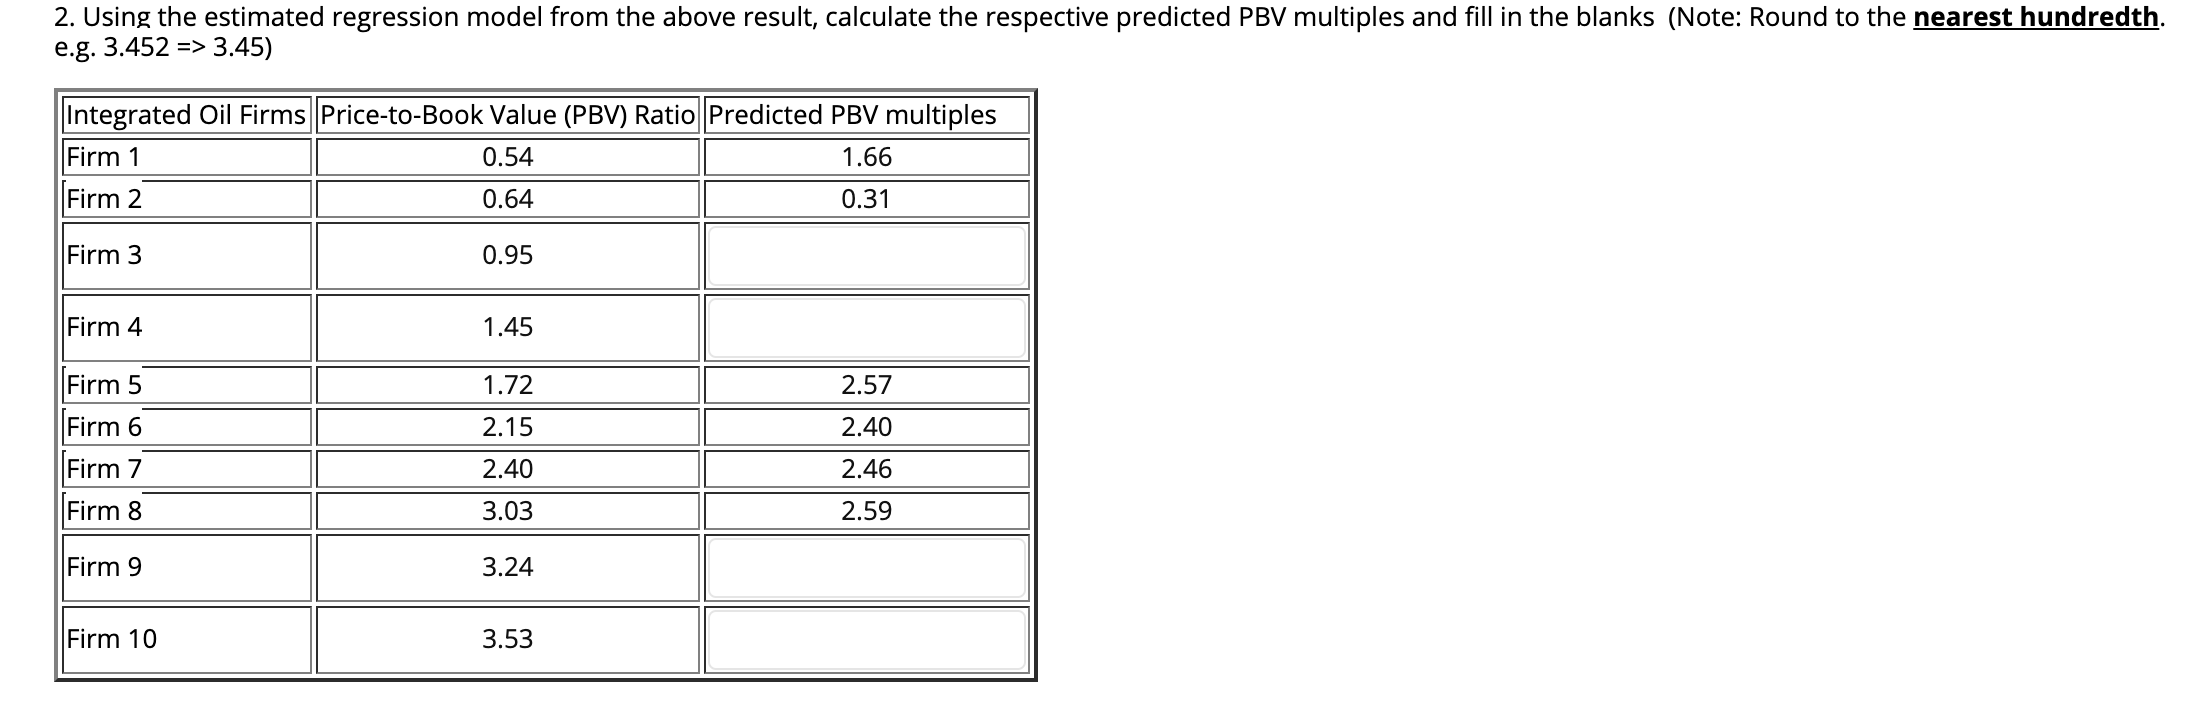
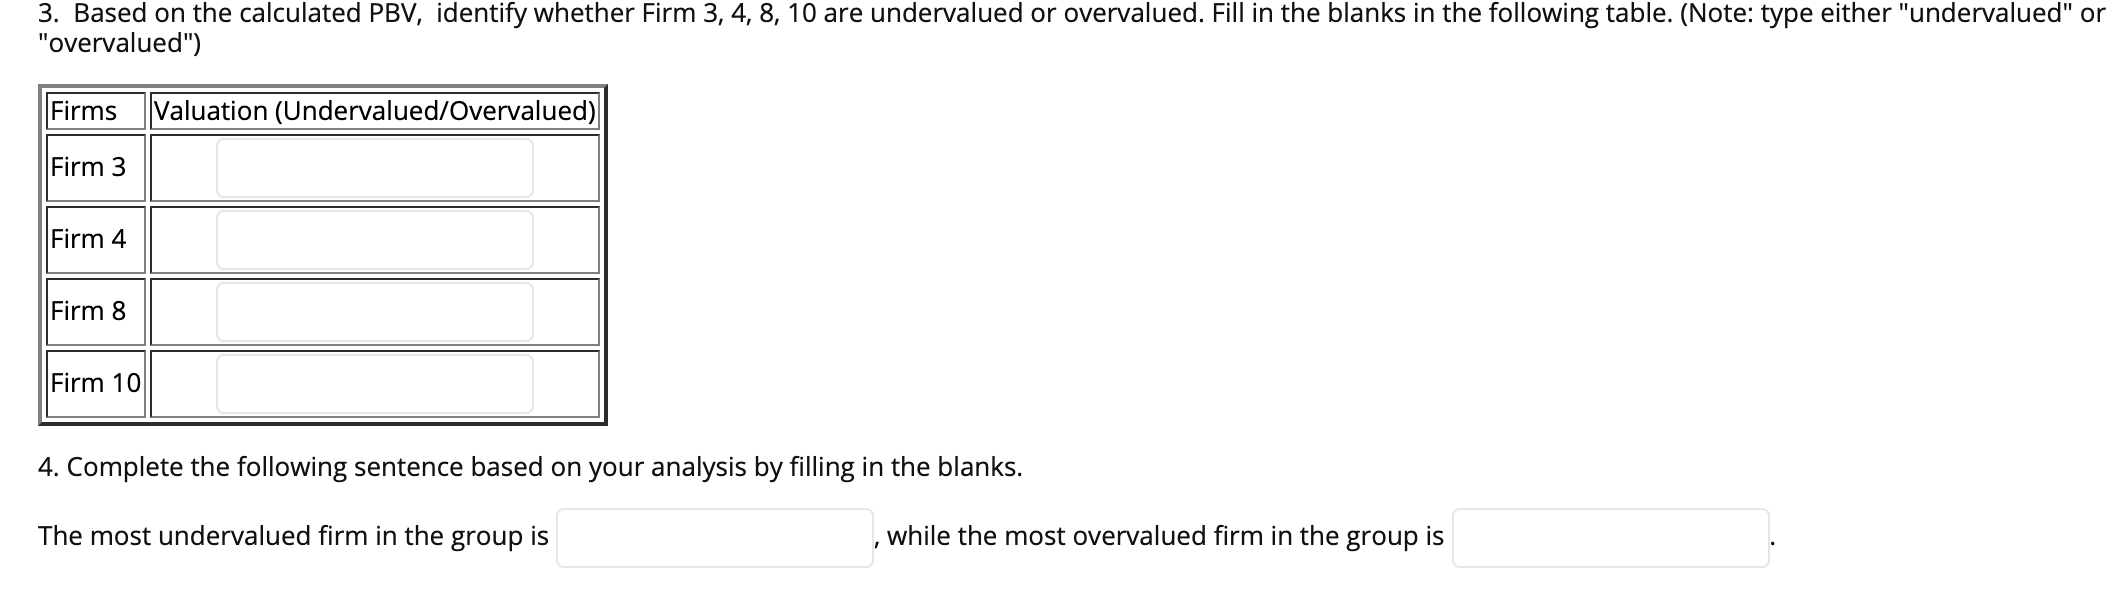
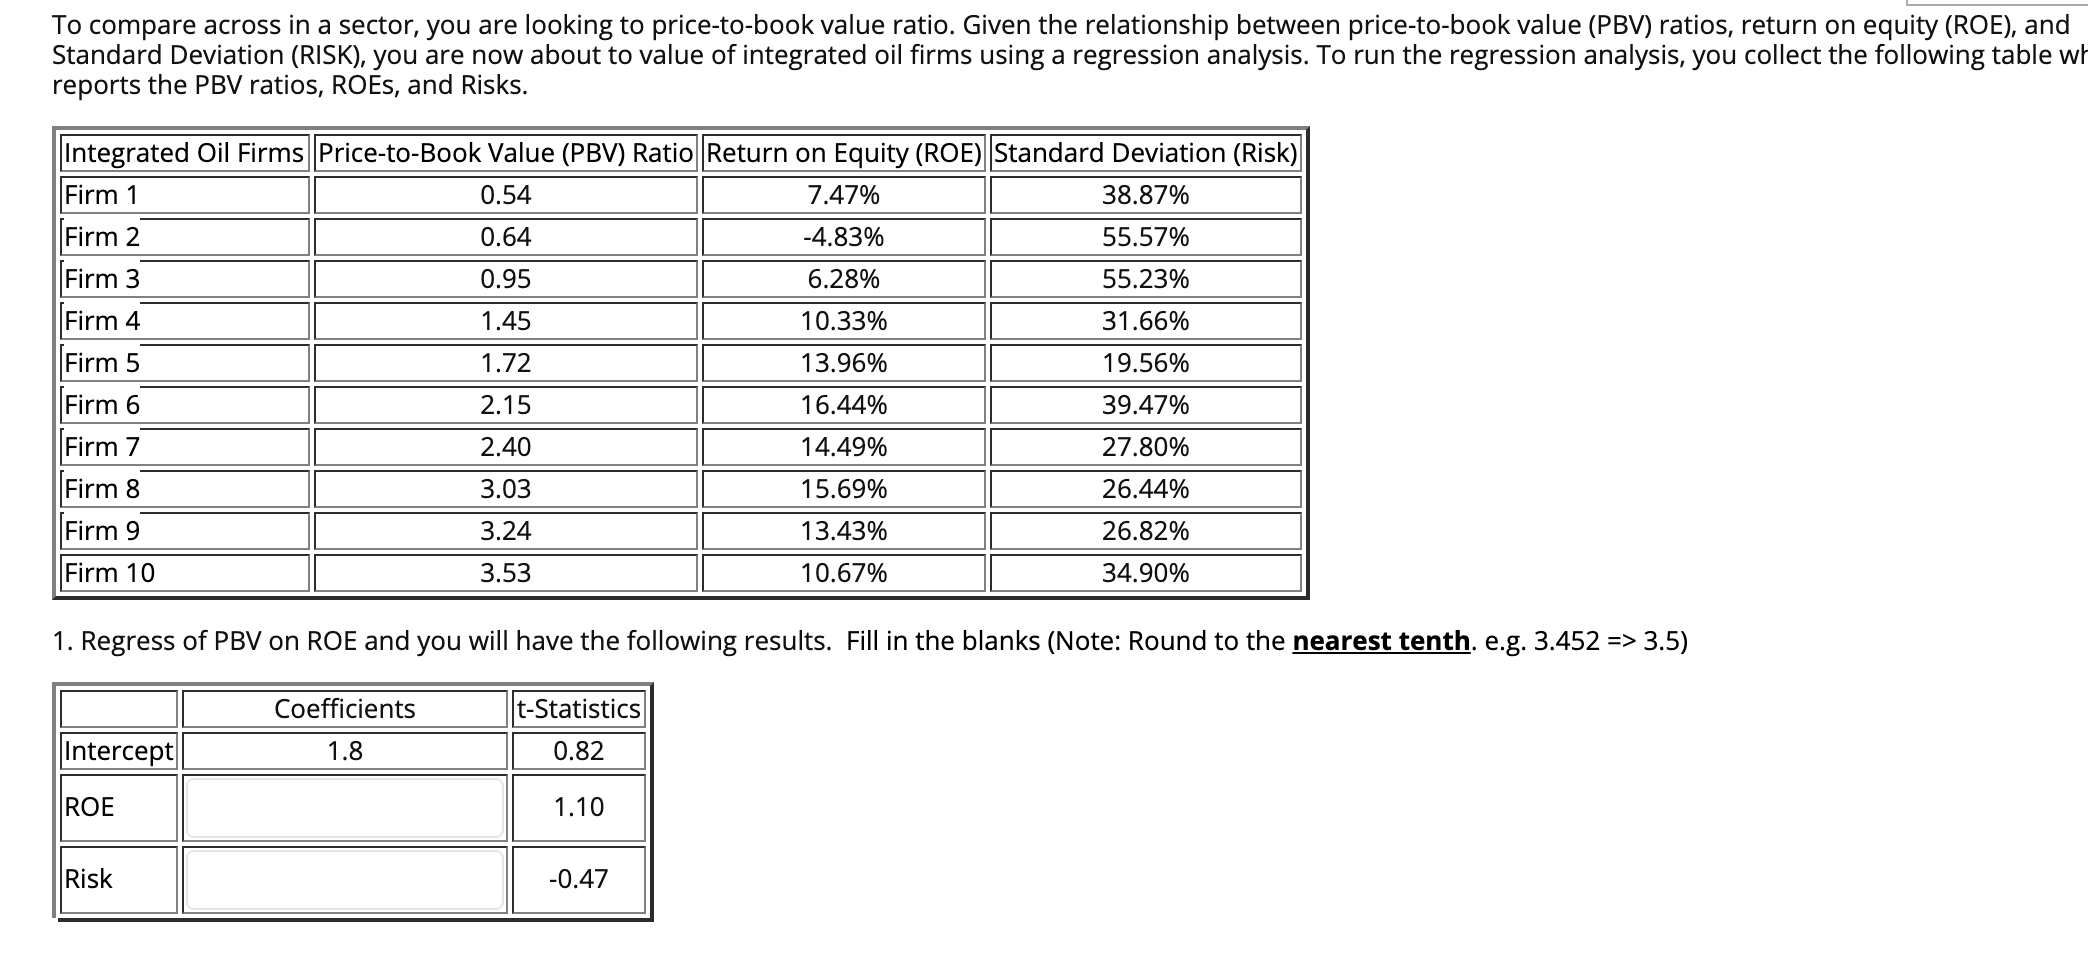
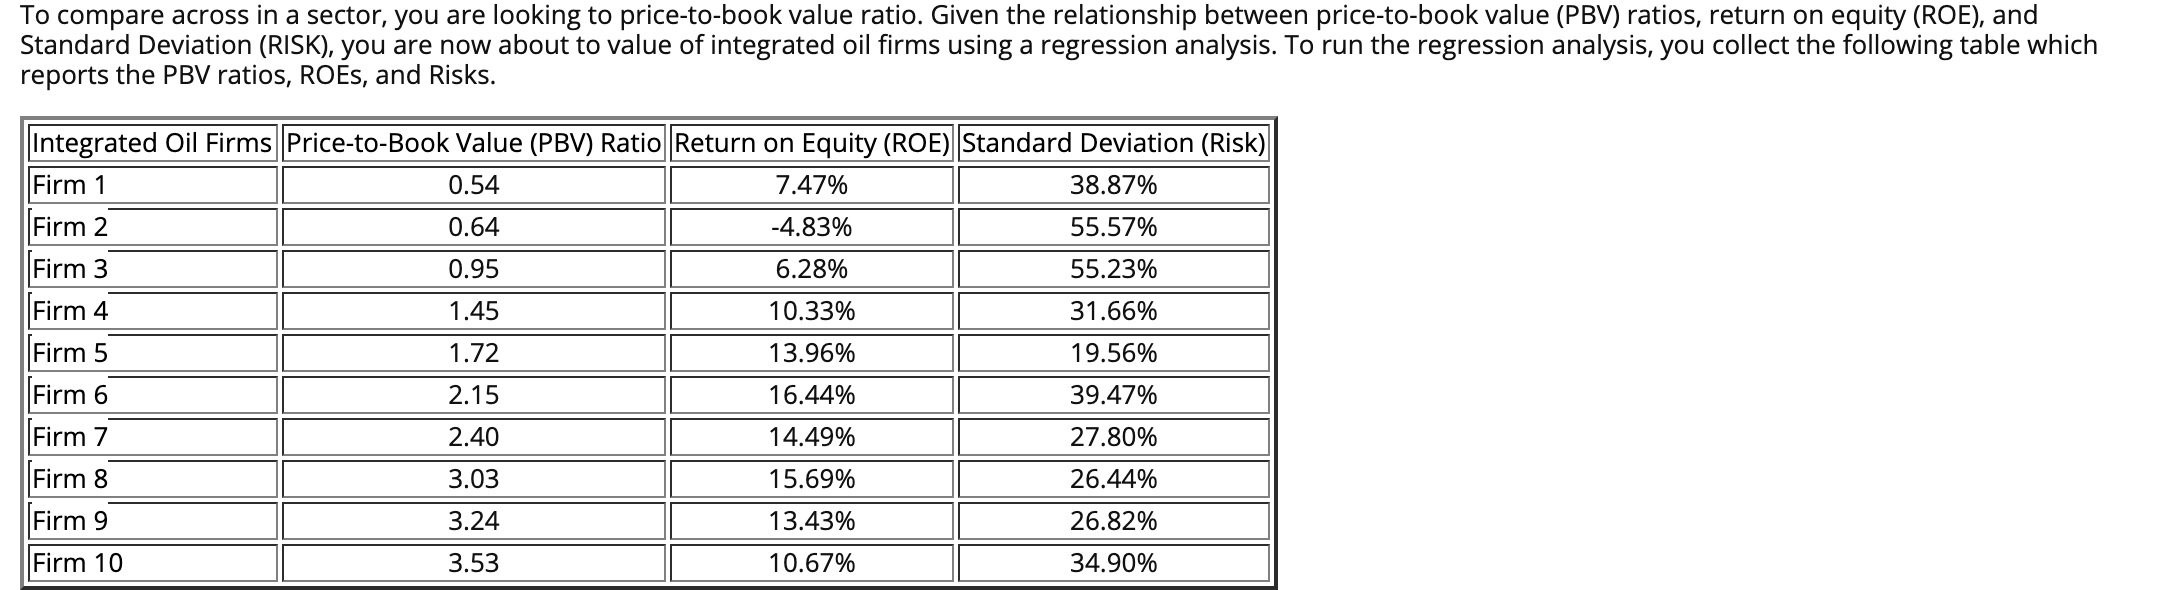
2. Using the estimated regression model from the above result, calculate the respective predicted PBV multiples and fill in the blanks (Note: Round to the nearest hundredth. e.g. 3.452 => 3.45) Integrated Oil Firms ||Price-to-Book Value (PBV) Ratio Predicted PBV multiples Firm 1 0.54 1.66 Firm 2 0.64 0.31 Firm 3 0.95 Firm 4 1.45 Firm 5 1.72 2.57 Firm 6 2.15 2.40 Firm 7 2.40 2.46 Firm 8 3.03 2.59 Firm 9 3.24 Firm 10 3.53 3. Based on the calculated PBV, identify whether Firm 3, 4, 8, 10 are undervalued or overvalued. Fill in the blanks in the following table. (Note: type either "undervalued" or "overvalued") Firms Valuation (Undervalued/Overvalued) Firm 3 Firm 4 Firm 8 Firm 10 4. Complete the following sentence based on your analysis by filling in the blanks. The most undervalued firm in the group is while the most overvalued firm in the group is I To compare across in a sector, you are looking to price-to-book value ratio. Given the relationship between price-to-book value (PBV) ratios, return on equity (ROE), and Standard Deviation (RISK), you are now about to value of integrated oil firms using a regression analysis. To run the regression analysis, you collect the following table wh reports the PBV ratios, ROEs, and Risks. Integrated Oil Firms Price-to-Book Value (PBV) Ratio Return on Equity (ROE) Standard Deviation (Risk) Firm 1 0.54 7.47% 38.87% Firm 2 0.64 -4.83% 55.57% Firm 3 0.95 6.28% 55.23% Firm 4 1.45 10.33% 31.66% Firm 5 1.72 13.96% 19.56% Firm 6 2.15 16.44% 39.47% Firm 7 2.40 14.49% 27.80% Firm 8 3.03 15.69% 26.44% Firm 9 3.24 13.43% 26.82% Firm 10 3.53 10.67% 34.90% 1. Regress of PBV on ROE and you will have the following results. Fill in the blanks (Note: Round to the nearest tenth. e.g. 3.452 => 3.5) Coefficients t-Statistics Intercept 1.8 0.82 ROE 1.10 Risk -0.47 To compare across in a sector, you are looking to price-to-book value ratio. Given the relationship between price-to-book value (PBV) ratios, return on equity (ROE), and Standard Deviation (RISK), you are now about to value of integrated oil firms using a regression analysis. To run the regression analysis, you collect the following table which reports the PBV ratios, ROEs, and Risks. Integrated Oil Firms ||Price-to-Book Value (PBV) Ratio Return on Equity (ROE) Standard Deviation (Risk) Firm 1 0.54 7.47% 38.87% Firm 2 0.64 -4.83% 55.57% Firm 3 0.95 6.28% 55.23% Firm 4 1.45 10.33% 31.66% Firm 5 1.72 13.96% 19.56% Firm 6 2.15 16.44% 39.47% Firm 7 2.40 14.49% 27.80% Firm 8 3.03 15.69% 26.44% Firm 9 3.24 13.43% 26.82% Firm 10 3.53 10.67% 34.90% 2. Using the estimated regression model from the above result, calculate the respective predicted PBV multiples and fill in the blanks (Note: Round to the nearest hundredth. e.g. 3.452 => 3.45) Integrated Oil Firms ||Price-to-Book Value (PBV) Ratio Predicted PBV multiples Firm 1 0.54 1.66 Firm 2 0.64 0.31 Firm 3 0.95 Firm 4 1.45 Firm 5 1.72 2.57 Firm 6 2.15 2.40 Firm 7 2.40 2.46 Firm 8 3.03 2.59 Firm 9 3.24 Firm 10 3.53 3. Based on the calculated PBV, identify whether Firm 3, 4, 8, 10 are undervalued or overvalued. Fill in the blanks in the following table. (Note: type either "undervalued" or "overvalued") Firms Valuation (Undervalued/Overvalued) Firm 3 Firm 4 Firm 8 Firm 10 4. Complete the following sentence based on your analysis by filling in the blanks. The most undervalued firm in the group is while the most overvalued firm in the group is I To compare across in a sector, you are looking to price-to-book value ratio. Given the relationship between price-to-book value (PBV) ratios, return on equity (ROE), and Standard Deviation (RISK), you are now about to value of integrated oil firms using a regression analysis. To run the regression analysis, you collect the following table wh reports the PBV ratios, ROEs, and Risks. Integrated Oil Firms Price-to-Book Value (PBV) Ratio Return on Equity (ROE) Standard Deviation (Risk) Firm 1 0.54 7.47% 38.87% Firm 2 0.64 -4.83% 55.57% Firm 3 0.95 6.28% 55.23% Firm 4 1.45 10.33% 31.66% Firm 5 1.72 13.96% 19.56% Firm 6 2.15 16.44% 39.47% Firm 7 2.40 14.49% 27.80% Firm 8 3.03 15.69% 26.44% Firm 9 3.24 13.43% 26.82% Firm 10 3.53 10.67% 34.90% 1. Regress of PBV on ROE and you will have the following results. Fill in the blanks (Note: Round to the nearest tenth. e.g. 3.452 => 3.5) Coefficients t-Statistics Intercept 1.8 0.82 ROE 1.10 Risk -0.47 To compare across in a sector, you are looking to price-to-book value ratio. Given the relationship between price-to-book value (PBV) ratios, return on equity (ROE), and Standard Deviation (RISK), you are now about to value of integrated oil firms using a regression analysis. To run the regression analysis, you collect the following table which reports the PBV ratios, ROEs, and Risks. Integrated Oil Firms ||Price-to-Book Value (PBV) Ratio Return on Equity (ROE) Standard Deviation (Risk) Firm 1 0.54 7.47% 38.87% Firm 2 0.64 -4.83% 55.57% Firm 3 0.95 6.28% 55.23% Firm 4 1.45 10.33% 31.66% Firm 5 1.72 13.96% 19.56% Firm 6 2.15 16.44% 39.47% Firm 7 2.40 14.49% 27.80% Firm 8 3.03 15.69% 26.44% Firm 9 3.24 13.43% 26.82% Firm 10 3.53 10.67% 34.90%
Step by Step Solution
There are 3 Steps involved in it

Get step-by-step solutions from verified subject matter experts