

Question: 2. Using the forecast model for pasta shown in Exhibit 5, what is your forecast of the demand for pizza? (Hint: Complete the excel spreadsheet

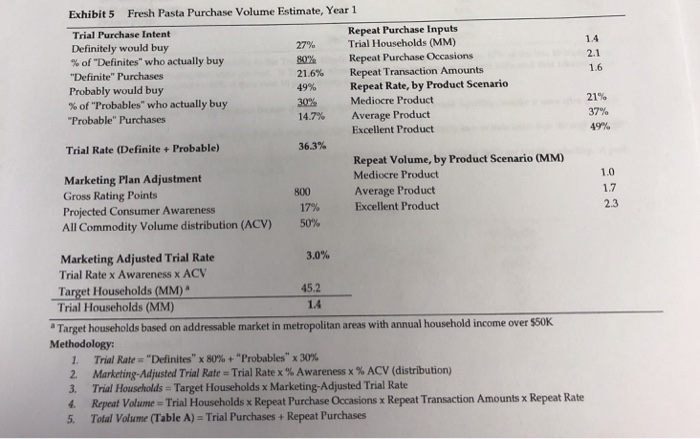
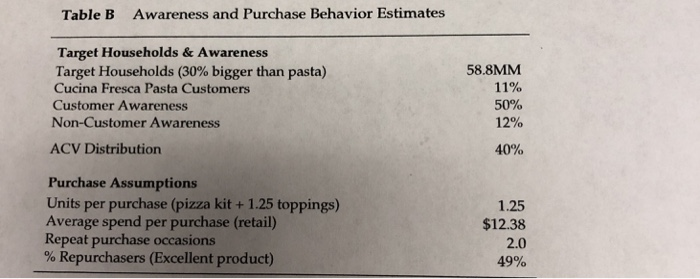
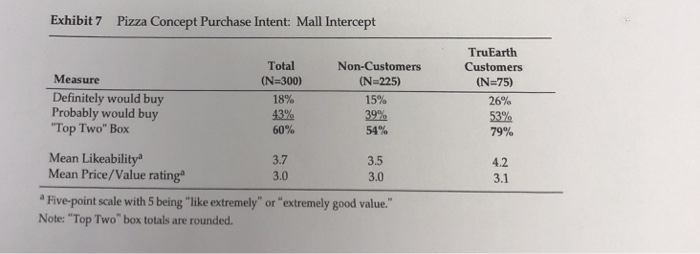
2. Using the forecast model for pasta shown in Exhibit 5, what is your forecast of the demand for pizza? (Hint: Complete the excel spreadsheet using data in Table B and Exhibit 7) Exhibit 5 Fresh Pasta Purchase Volume Estimate, Year 1 Trial Purchase Intent Definitely would buy % of-Definites" who actually buy Definite" Purchases Probably would buy % of "Probab les" who actually buy "Probable" Purchases Repeat Purchase Inputs Trial Households (MM) Repeat Purchase Occasions Repeat Transaction Amounts Repeat Rate, by Product Scenario Mediocre Product Average Product Excellent Product 27% 80% 21.6% 49% 30% 14.7% 1.4 2.1 1.6 21% 37% 49% Trial Rate (Definite + Probable) 36.3% Repeat Volume, by Product Scenario (MM) Mediocre Product Average Product Excellent Product Marketing Plan Adjustment Gross Rating Points Projected Consumer Awareness All Commodity Volume distribution (ACV) 1.0 1.7 2.3 800 17% 50% Marketing Adjusted Trial Rate Trial Rate x Awareness x ACV 3.0% Target Households (MM) 45.2 Trial Households (MM) 1.4 Target households based on addressable market in metropolitan areas with annual household income over $50K Methodology: "Definites" x 80% + "Probables" x 30% 1, Trial Rate Marketing-Adjusted Trial Rate Trial Rate x % Awareness x % ACV (distribution) 3. Trial Households Target Households x Marketing-Adjusted Trial Rate 4. Repeat Volume Trial Households x Repeat Purchasecasions x Repeat Transaction Amounts x Repeat Rate 5. Total Volume (Table A)-Trial Purchases + Repeat Purchases Awareness and Purchase Behavior Estimates Table B Target Households & Awareness Target Households (30% bigger than pasta) Cucina Fresca Pasta Customers Customer Awareness Non-Customer Awareness 58.8MM 11% 50% 12% ACV Distribution 40% Purchase Assumptions Units per purchase (pizza kit + 1.25 toppings) Average spend per purchase (retail) Repeat purchase occasions % Repurchases (Excellent product) 1.25 $12.38 2.0 49% Exhibit7 Pizza Concept Purchase Intent: Mall Intercept TruEarth Total (N-300) 18% 43% 60% Non-Customers (N 225) 15% 39% 54% Customers Measure Definitely would buy Probably would buy Top Two Box (N-75) 26% 5% Mean Likeability Mean Price/Value rating 3.7 3.0 3.5 3.0 4.2 3.1 a Five-point scale with 5 being "like extremely" or "extremely good value. Note: "Top Two" box totals are rounded. 2. Using the forecast model for pasta shown in Exhibit 5, what is your forecast of the demand for pizza? (Hint: Complete the excel spreadsheet using data in Table B and Exhibit 7) Exhibit 5 Fresh Pasta Purchase Volume Estimate, Year 1 Trial Purchase Intent Definitely would buy % of-Definites" who actually buy Definite" Purchases Probably would buy % of "Probab les" who actually buy "Probable" Purchases Repeat Purchase Inputs Trial Households (MM) Repeat Purchase Occasions Repeat Transaction Amounts Repeat Rate, by Product Scenario Mediocre Product Average Product Excellent Product 27% 80% 21.6% 49% 30% 14.7% 1.4 2.1 1.6 21% 37% 49% Trial Rate (Definite + Probable) 36.3% Repeat Volume, by Product Scenario (MM) Mediocre Product Average Product Excellent Product Marketing Plan Adjustment Gross Rating Points Projected Consumer Awareness All Commodity Volume distribution (ACV) 1.0 1.7 2.3 800 17% 50% Marketing Adjusted Trial Rate Trial Rate x Awareness x ACV 3.0% Target Households (MM) 45.2 Trial Households (MM) 1.4 Target households based on addressable market in metropolitan areas with annual household income over $50K Methodology: "Definites" x 80% + "Probables" x 30% 1, Trial Rate Marketing-Adjusted Trial Rate Trial Rate x % Awareness x % ACV (distribution) 3. Trial Households Target Households x Marketing-Adjusted Trial Rate 4. Repeat Volume Trial Households x Repeat Purchasecasions x Repeat Transaction Amounts x Repeat Rate 5. Total Volume (Table A)-Trial Purchases + Repeat Purchases Awareness and Purchase Behavior Estimates Table B Target Households & Awareness Target Households (30% bigger than pasta) Cucina Fresca Pasta Customers Customer Awareness Non-Customer Awareness 58.8MM 11% 50% 12% ACV Distribution 40% Purchase Assumptions Units per purchase (pizza kit + 1.25 toppings) Average spend per purchase (retail) Repeat purchase occasions % Repurchases (Excellent product) 1.25 $12.38 2.0 49% Exhibit7 Pizza Concept Purchase Intent: Mall Intercept TruEarth Total (N-300) 18% 43% 60% Non-Customers (N 225) 15% 39% 54% Customers Measure Definitely would buy Probably would buy Top Two Box (N-75) 26% 5% Mean Likeability Mean Price/Value rating 3.7 3.0 3.5 3.0 4.2 3.1 a Five-point scale with 5 being "like extremely" or "extremely good value. Note: "Top Two" box totals are rounded
Step by Step Solution
There are 3 Steps involved in it

Get step-by-step solutions from verified subject matter experts