

Question: 2. Using the semi-annually compounded yield curve in Table 1, compute the change in the value of the two portfolios below stemming from duration and
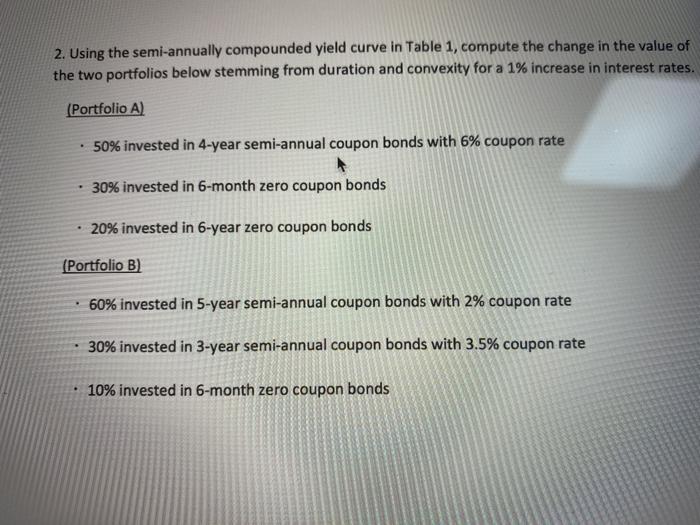
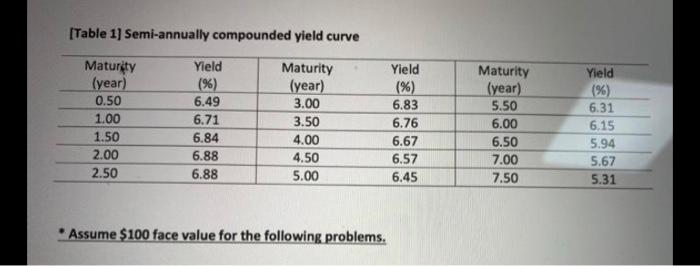
2. Using the semi-annually compounded yield curve in Table 1, compute the change in the value of the two portfolios below stemming from duration and convexity for a 1% increase in interest rates. (Portfolio A) 50% invested in 4-year semi-annual coupon bonds with 6% coupon rate 30% invested in 6-month zero coupon bonds 20% invested in 6-year zero coupon bonds (Portfolio B) 60% invested in 5-year semi-annual coupon bonds with 2% coupon rate 30% invested in 3-year semi-annual coupon bonds with 3.5% coupon rate 10% invested in 6-month zero coupon bonds [Table 1) Semi-annually compounded yield curve Yield Maturety (year) 0.50 1.00 1.50 2.00 2.50 6.49 6.71 6.84 6.88 Maturity (year) 3.00 3.50 4.00 4.50 5.00 Yield (%) 6.83 6.76 6.67 6.57 6.45 Maturity (year) 5.50 6.00 6.50 7.00 7.50 Yield (%) 6.31 6.15 5.94 5.67 5.31 6.88 Assume $100 face value for the following problems. 2. Using the semi-annually compounded yield curve in Table 1, compute the change in the value of the two portfolios below stemming from duration and convexity for a 1% increase in interest rates. (Portfolio A) 50% invested in 4-year semi-annual coupon bonds with 6% coupon rate 30% invested in 6-month zero coupon bonds 20% invested in 6-year zero coupon bonds (Portfolio B) 60% invested in 5-year semi-annual coupon bonds with 2% coupon rate 30% invested in 3-year semi-annual coupon bonds with 3.5% coupon rate 10% invested in 6-month zero coupon bonds [Table 1) Semi-annually compounded yield curve Yield Maturety (year) 0.50 1.00 1.50 2.00 2.50 6.49 6.71 6.84 6.88 Maturity (year) 3.00 3.50 4.00 4.50 5.00 Yield (%) 6.83 6.76 6.67 6.57 6.45 Maturity (year) 5.50 6.00 6.50 7.00 7.50 Yield (%) 6.31 6.15 5.94 5.67 5.31 6.88 Assume $100 face value for the following problems
Step by Step Solution
There are 3 Steps involved in it

Get step-by-step solutions from verified subject matter experts