

Question: 2. We use the Bridge.txt dataset where information from 45 bridge projects are compiled. The response and predictor variables are as follows: Y: Time is
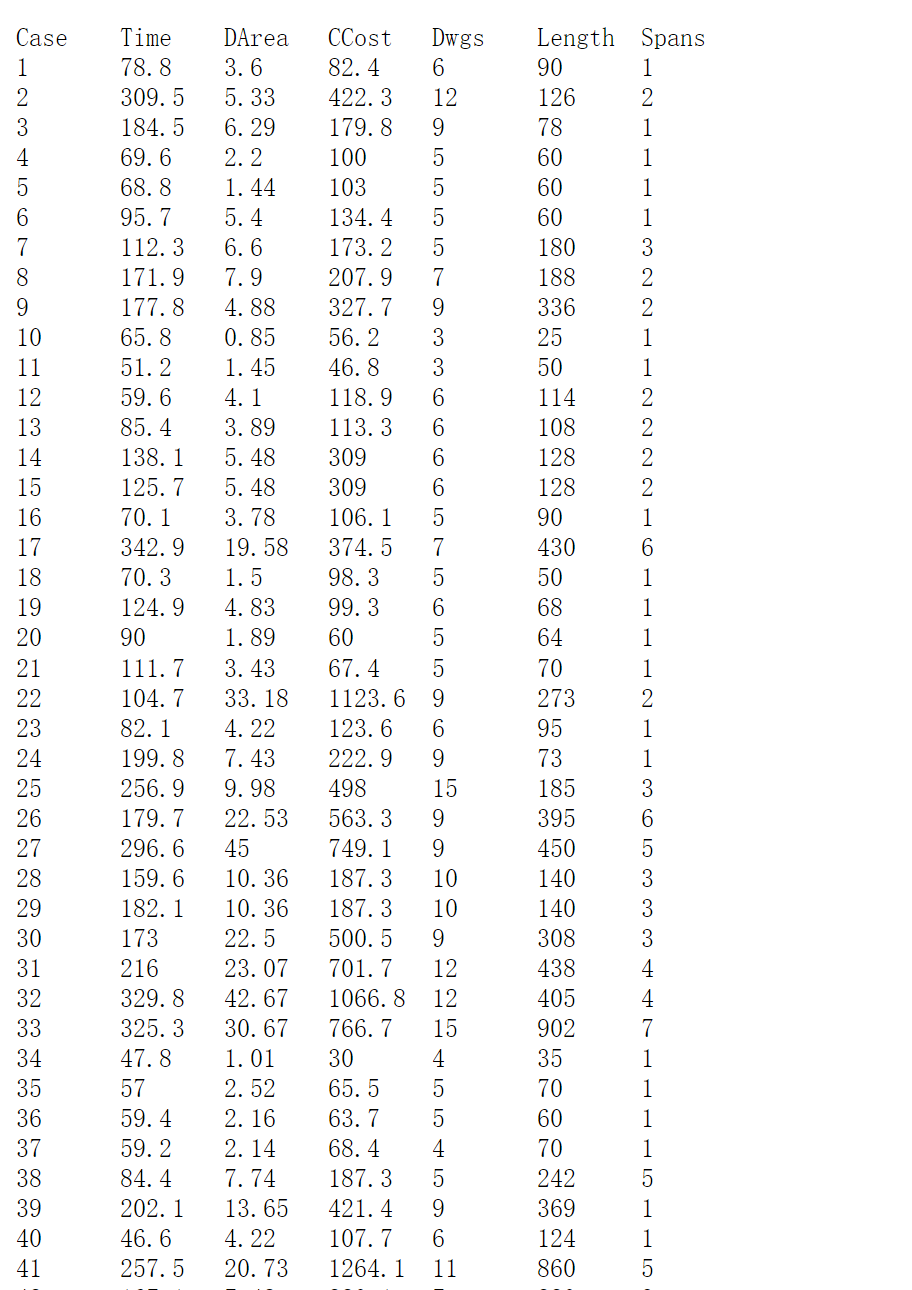
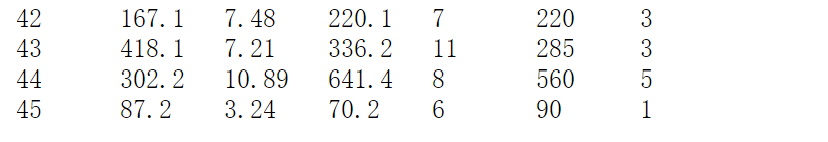
2. We use the Bridge.txt dataset where information from 45 bridge projects are compiled. The response and predictor variables are as follows: Y: Time is the design time in person-days; X1: DArea is the deck area of bridge (000 sq ft); X2: CCost is the construction cost ($000); X3: Dwgs is the number of structural drawings; X4: Length is the length of bridge (ft); X5: Spans is the number of spans. . Take the logarithm transformation of all the variables. (a) By using the AIC find the best two models. For the two best models, find the leverage values and the Cook's distance values and comment on them. Case 10 = 60 edge SUSP056856 G A TOT EE0 v OCTA WN Time 78.8 309.5 184.5 69.6 68.8 95. 7 112. 3 171.9 177.8 65.8 51.2 59.6 85.4. 138. 1 125. 7 70.1 342.9 70.3 124. 9 90 111.7 104. 7 82. 1 199.8 256.9 179.7 296.6 159.6 182. 1 173 216 329.8 325. 3 47.8 57 59.4 59. 2 84. 4 202. 1 46.6 257.5 DArea 3.6 5. 33 6. 29 2. 2 1. 44 5.4 6. 6 7.9 4. 88 0.85 1. 45 4.1 3. 89 5. 48 5. 48 3. 78 19. 58 1. 5 4. 83 1. 89 3. 43 33. 18 4. 22 7. 43 9.98 22. 53 45 10. 36 10. 36 22.5 23.07 42. 67 30.67 1. 01 2. 52 2. 16 2. 14 7.74 13. 65 4. 22 20. 73 CCost Dwgs 82. 4 6 422.3 12 179.8 9 100 103 5 134.4 5 173. 2 5 207.9 7 327.7 9 56.2 46.8 3 118.9 113. 3 309 6 309 106. 1 5 374.5 7 98.3 99.3 6 60 5 67.4 5 1123. 6 9 123.6 222.9 498 563.3 9 749.1 9 187.3 10 187.3 10 500.5 9 701.7 12 1066.8 12 766. 7 15 30 4 65.5 63. 7 5 68.4 4 187. 3 5 421.4. 9 107.7 6 1264. 1 11 Length Spans 90 1 126 2 78 60 60 60 180 3 188 2 336 2 25 50 114 2 108 2 128 2 128 2 90 430 6 50 68 64 70 1 273 2 95 73 185 3 395 6 450 5 140 3 140 3 308 3 438 4 405 4 902 7 35 1 70 1 60 1 70 242 5 369 1 124 860 5 wwwU1 OWNEFPONNNNNN WEN 28 01 01 40 42 43 44 45 167.1 418. 1 302. 2 87.2 7. 48 7. 21 10. 89 3. 24 220.1 336.2 641.4 70.2 7 11 8 6 220 285 560 90 3 3 5 1 33 5 - 2. We use the Bridge.txt dataset where information from 45 bridge projects are compiled. The response and predictor variables are as follows: Y: Time is the design time in person-days; X1: DArea is the deck area of bridge (000 sq ft); X2: CCost is the construction cost ($000); X3: Dwgs is the number of structural drawings; X4: Length is the length of bridge (ft); X5: Spans is the number of spans. . Take the logarithm transformation of all the variables. (a) By using the AIC find the best two models. For the two best models, find the leverage values and the Cook's distance values and comment on them. Case 10 = 60 edge SUSP056856 G A TOT EE0 v OCTA WN Time 78.8 309.5 184.5 69.6 68.8 95. 7 112. 3 171.9 177.8 65.8 51.2 59.6 85.4. 138. 1 125. 7 70.1 342.9 70.3 124. 9 90 111.7 104. 7 82. 1 199.8 256.9 179.7 296.6 159.6 182. 1 173 216 329.8 325. 3 47.8 57 59.4 59. 2 84. 4 202. 1 46.6 257.5 DArea 3.6 5. 33 6. 29 2. 2 1. 44 5.4 6. 6 7.9 4. 88 0.85 1. 45 4.1 3. 89 5. 48 5. 48 3. 78 19. 58 1. 5 4. 83 1. 89 3. 43 33. 18 4. 22 7. 43 9.98 22. 53 45 10. 36 10. 36 22.5 23.07 42. 67 30.67 1. 01 2. 52 2. 16 2. 14 7.74 13. 65 4. 22 20. 73 CCost Dwgs 82. 4 6 422.3 12 179.8 9 100 103 5 134.4 5 173. 2 5 207.9 7 327.7 9 56.2 46.8 3 118.9 113. 3 309 6 309 106. 1 5 374.5 7 98.3 99.3 6 60 5 67.4 5 1123. 6 9 123.6 222.9 498 563.3 9 749.1 9 187.3 10 187.3 10 500.5 9 701.7 12 1066.8 12 766. 7 15 30 4 65.5 63. 7 5 68.4 4 187. 3 5 421.4. 9 107.7 6 1264. 1 11 Length Spans 90 1 126 2 78 60 60 60 180 3 188 2 336 2 25 50 114 2 108 2 128 2 128 2 90 430 6 50 68 64 70 1 273 2 95 73 185 3 395 6 450 5 140 3 140 3 308 3 438 4 405 4 902 7 35 1 70 1 60 1 70 242 5 369 1 124 860 5 wwwU1 OWNEFPONNNNNN WEN 28 01 01 40 42 43 44 45 167.1 418. 1 302. 2 87.2 7. 48 7. 21 10. 89 3. 24 220.1 336.2 641.4 70.2 7 11 8 6 220 285 560 90 3 3 5 1 33 5
Step by Step Solution
There are 3 Steps involved in it

Get step-by-step solutions from verified subject matter experts