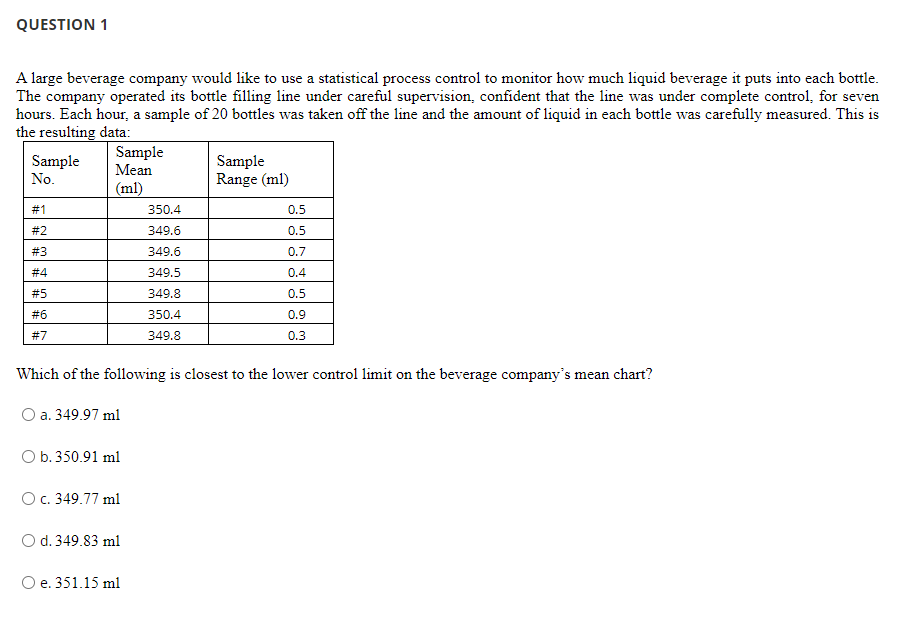
Question: How would I do this question, thank you QUESTION 1 A large beverage company would like to use a statistical process control to monitor how

How would I do this question, thank you QUESTIONHow would I do this question, thank you

QUESTION 1 A large beverage company would like to use a statistical process control to monitor how much liquid beverage it puts into each bottle. The company operated its bottle filling line under careful supervision, confident that the line was under complete control, for seven hours. Each hour, a sample of 20 bottles was taken off the line and the amount of liquid in each bottle was carefully measured. This is the resulting data: Sample Sample Sample Mean No. Range (ml) (ml) #1 350.4 0.5 #2 0.5 349.6 349.6 #3 0.7 #4 0.4 #5 349.5 349.8 350.4 349.8 #6 0.5 0.9 0.3 #7 Which of the following is closest to the lower control limit on the beverage company's mean chart? a. 349.97 ml O b.350.91 ml O c. 349.77 ml d. 349.83 ml O e. 351.15 ml

Step by Step Solution

There are 3 Steps involved in it

1 Expert Approved Answer
Step: 1 Unlock blur-text-image
Question Has Been Solved by an Expert!

Get step-by-step solutions from verified subject matter experts

Step: 2 Unlock
Step: 3 Unlock

Students Have Also Explored These Related General Management Questions!