

Question: 2. Why the aggregate demand curve slopes downward The graph below shows the aggregate demand (AD) curve for a hypothetical economy. At point X, the
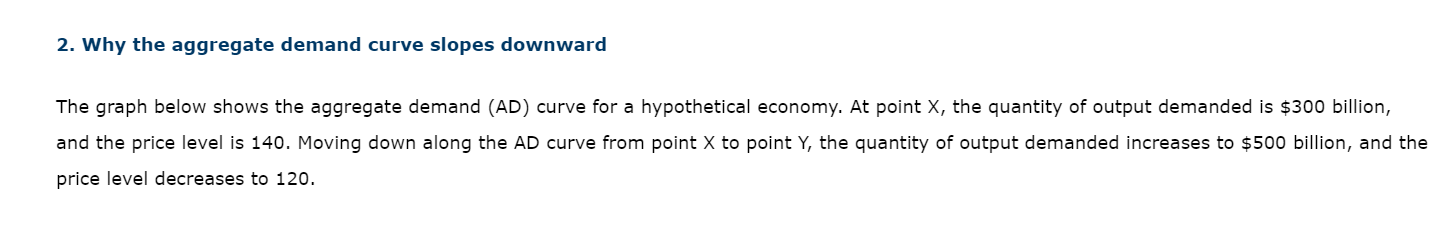
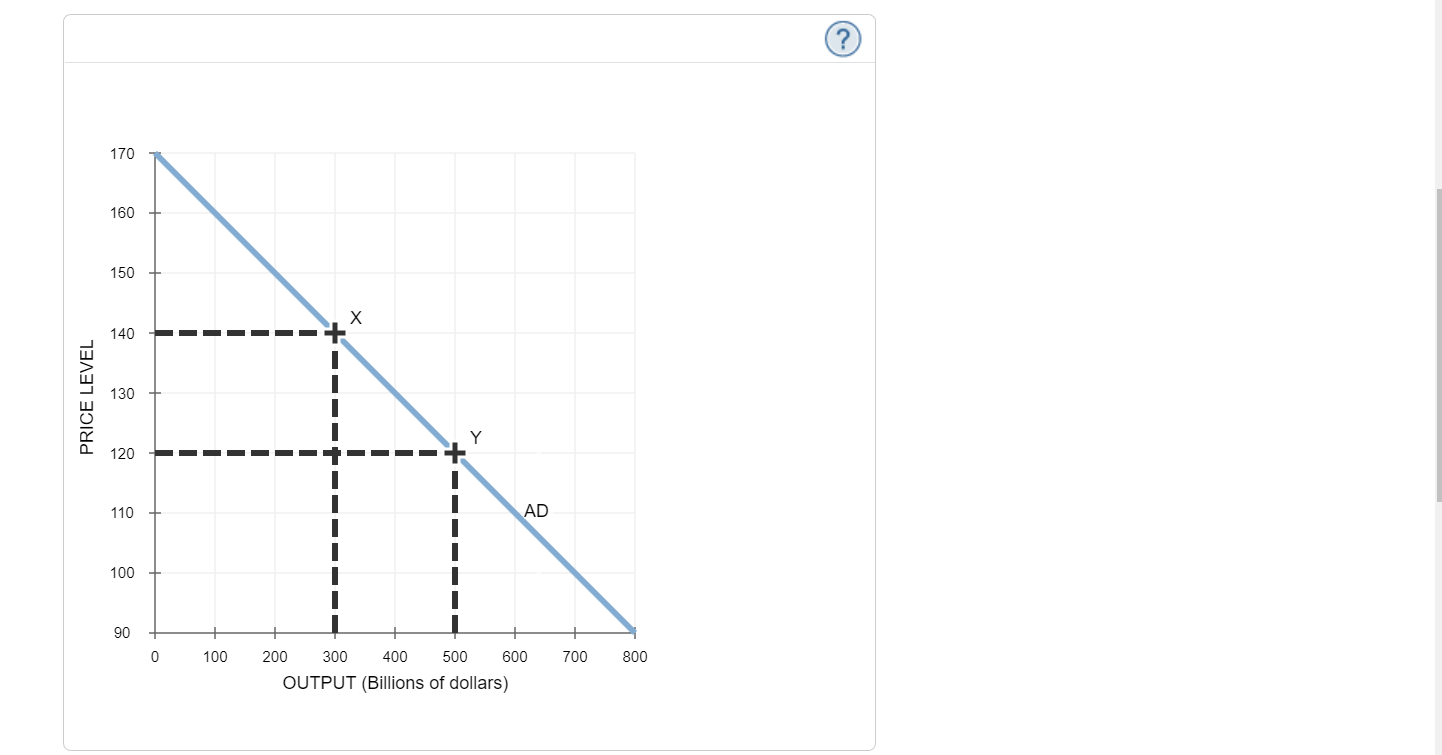
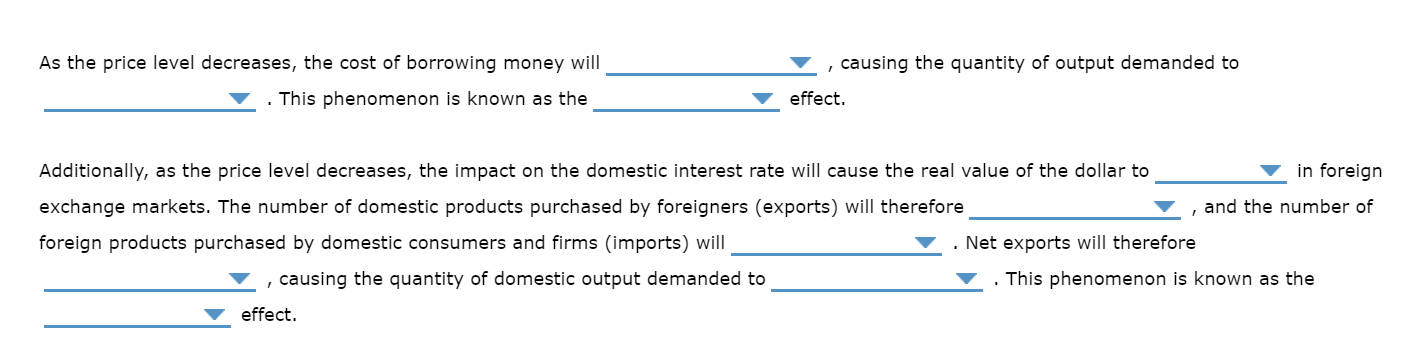
2. Why the aggregate demand curve slopes downward The graph below shows the aggregate demand (AD) curve for a hypothetical economy. At point X, the quantity of output demanded is $300 billion, and the price level is 140. Moving down along the AD curve from point X to point Y, the quantity of output demanded increases to $500 billion, and the price level decreases to 120. \fAs the price level decreases, the cost of borrowing money will V , causing the quantity of output demanded to V . This phenomenon is known as the V effect. Additionally, as the price level decreases, the impact on the domestic interest rate will cause the real value of the dollar to Y in foreign exchange markets. The number ofdomestic products purchased by foreigners (exports) will therefore V , and the number of foreign products purchased by domestic consumers and firms (imports) will V . Net exports will therefore V , causing the quantity of domestic output demanded to V . This phenomenon is known as the Y effect
Step by Step Solution
There are 3 Steps involved in it

Get step-by-step solutions from verified subject matter experts