

Question: Why the aggregate demand curve slopes downward The graph below shows the aggregate demand ( AD ) curve for a hypothetical economy. At point x
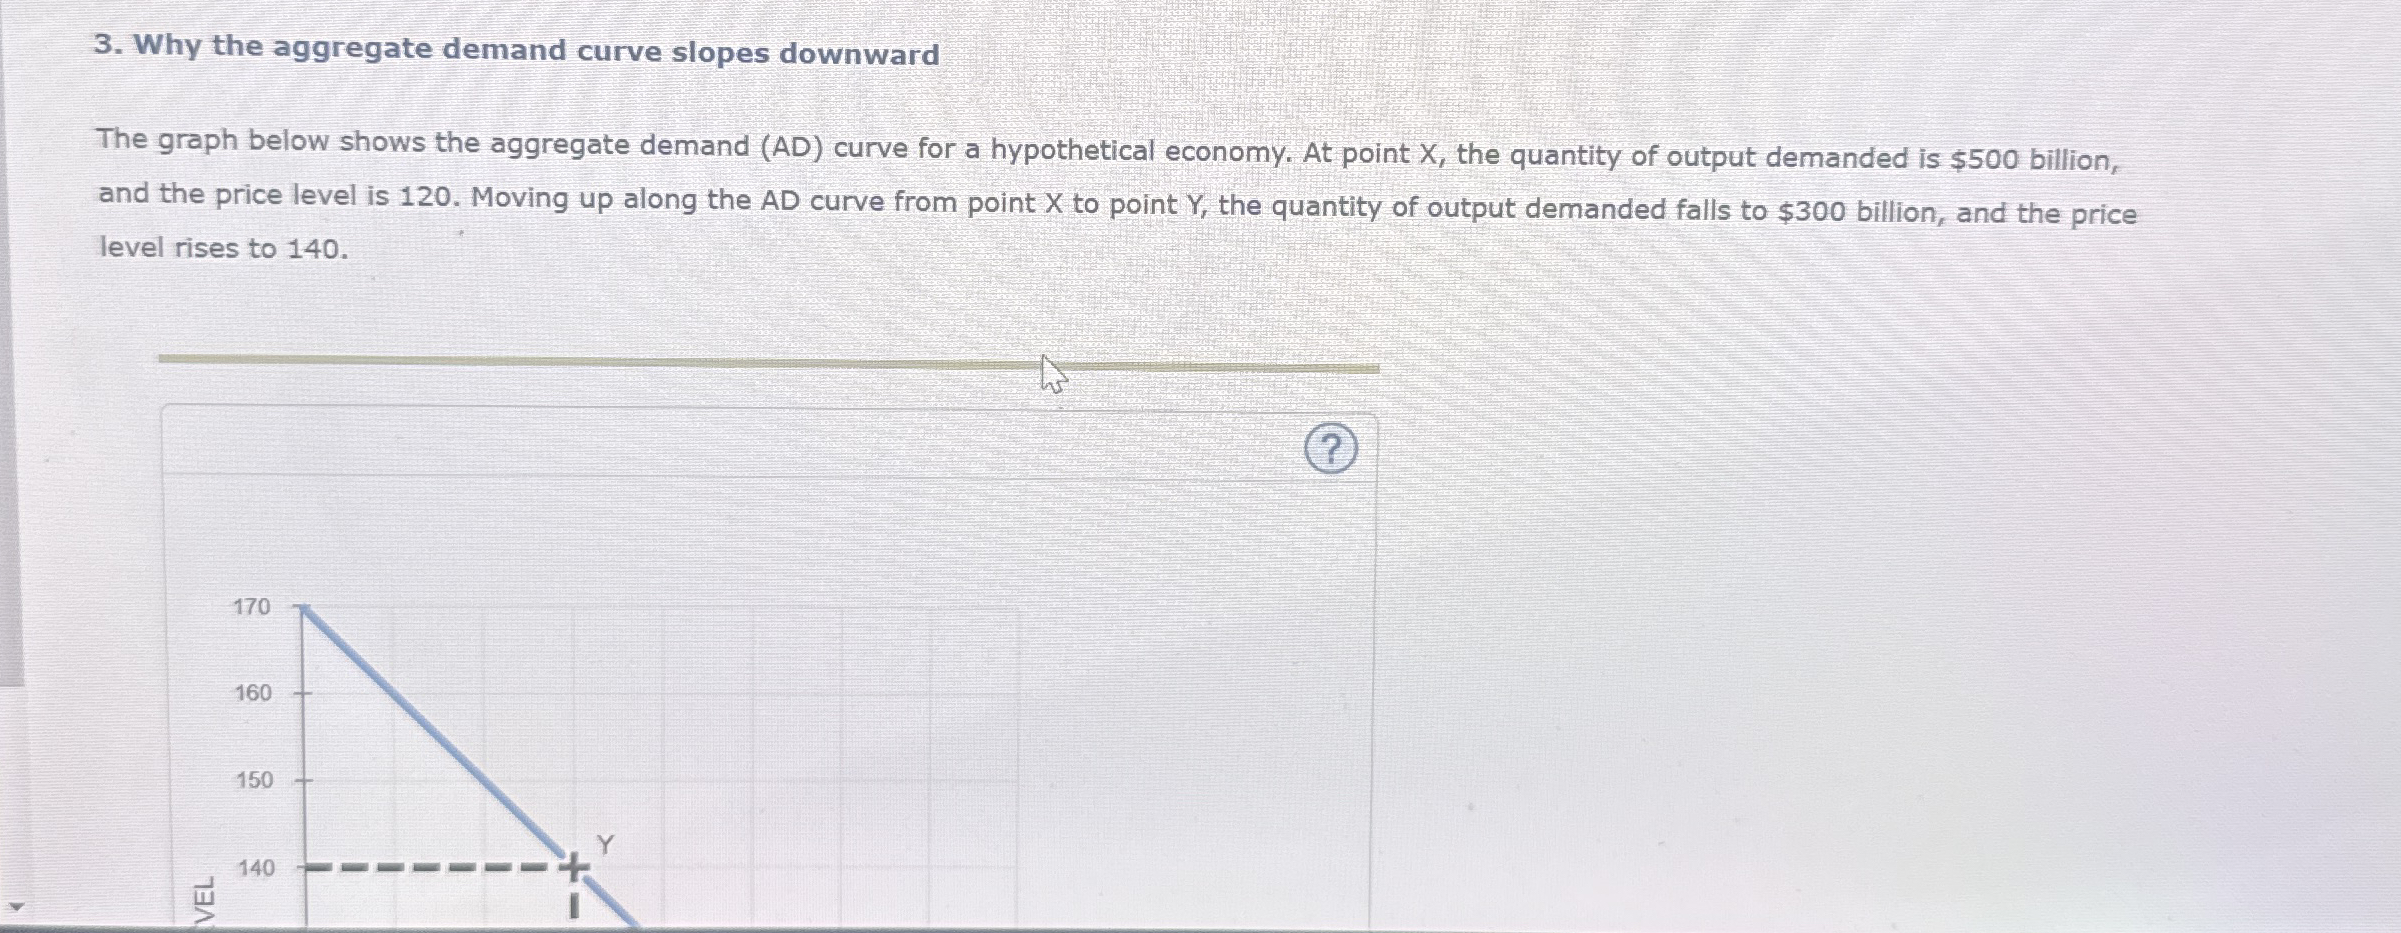
Why the aggregate demand curve slopes downward
The graph below shows the aggregate demand AD curve for a hypothetical economy. At point the quantity of output demanded is $ billion, and the price level is Moving up along the AD curve from point to point the quantity of output demanded falls to $ billion, and the price level rises to
Step by Step Solution
There are 3 Steps involved in it
1 Expert Approved Answer
Step: 1 Unlock

Question Has Been Solved by an Expert!
Get step-by-step solutions from verified subject matter experts
Step: 2 Unlock
Step: 3 Unlock