

Question: 2. with work shown please The Fresh Detergent Case Enterprise Industries produces Fresh, a brand of liquid detergent. In order to more effectively manage its
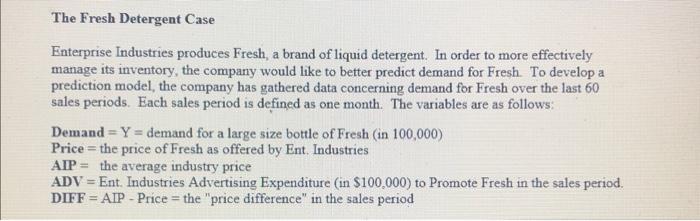
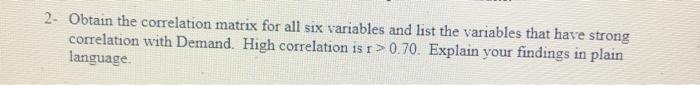
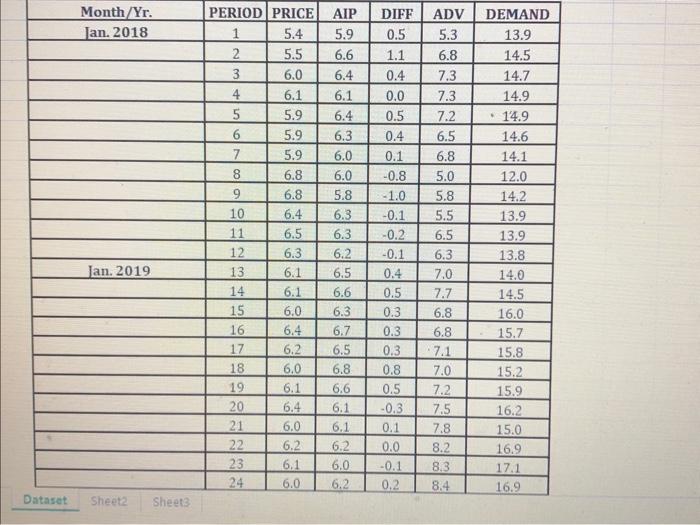
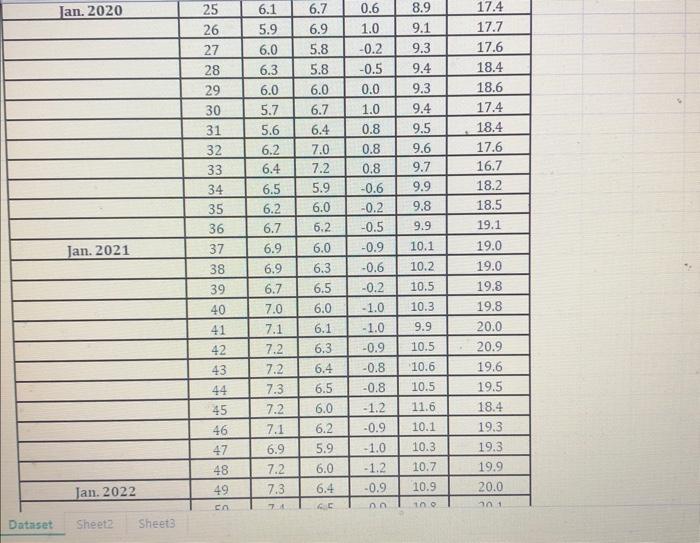
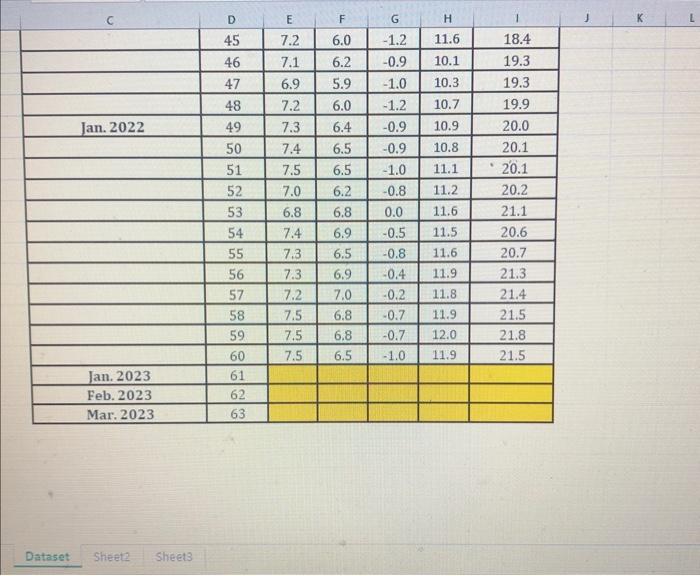
The Fresh Detergent Case Enterprise Industries produces Fresh, a brand of liquid detergent. In order to more effectively manage its inventory, the company would like to better predict demand for Fresh. To develop a prediction model, the company has gathered data concerning demand for Fresh over the last 60 sales periods. Each sales period is defined as one month. The variables are as follows: Demand =Y= demand for a large size bottle of Fresh (in 100,000) Price = the price of Fresh as offered by Ent. Industries AIP= the average industry price ADV = Ent. Industries Advertising Expenditure (in $100,000 ) to Promote Fresh in the sales period. DIFF = AIP - Price = the "price difference" in the sales period 2- Obtain the correlation matrix for all six variables and list the variables that have strong correlation with Demand. High correlation is r>0.70. Explain your findings in plain language. \begin{tabular}{|c|c|c|c|c|c|c|} \hline Month/Yr. & PERIOD & PRICE & AIP & DIFF & ADV & DEMAND \\ \hline Jan. 2018 & 1 & 5.4 & 5.9 & 0.5 & 5.3 & 13.9 \\ \hline & 2 & 5.5 & 6.6 & 1.1 & 6.8 & 14.5 \\ \hline & 3 & 6.0 & 6.4 & 0.4 & 7.3 & 14.7 \\ \hline & 4 & 6.1 & 6.1 & 0.0 & 7.3 & 14.9 \\ \hline & 5 & 5.9 & 6.4 & 0.5 & 7.2 & .14 .9 \\ \hline & 6 & 5.9 & 6.3 & 0.4 & 6.5 & 14.6 \\ \hline & 7 & 5.9 & 6.0 & 0.1 & 6.8 & 14.1 \\ \hline & 8 & 6.8 & 6.0 & -0.8 & 5.0 & 12.0 \\ \hline & 9 & 6.8 & 5.8 & -1.0 & 5.8 & 14.2 \\ \hline & 10 & 6.4 & 6.3 & -0.1 & 5.5 & 13.9 \\ \hline & 11 & 6.5 & 6.3 & -0.2 & 6.5 & 13.9 \\ \hline & 12 & 6.3 & 6.2 & -0.1 & 6.3 & 13.8 \\ \hline Jan. 2019 & 13 & 6.1 & 6.5 & 0.4 & 7.0 & 14.0 \\ \hline & 14 & 6.1 & 6.6 & 0.5 & 7.7 & 14.5 \\ \hline & 15 & 6.0 & 6.3 & 0.3 & 6.8 & 16.0 \\ \hline & 16 & 6.4 & 6.7 & 0.3 & 6.8 & 15.7 \\ \hline & 17 & 6.2 & 6.5 & 0.3 & 7.1 & 15.8 \\ \hline & 18 & 6.0 & 6.8 & 0.8 & 7.0 & 15.2 \\ \hline & 19 & 6.1 & 6.6 & 0.5 & 7.2 & 15.9 \\ \hline & 20 & 6.4 & 6.1 & -0.3 & 7.5 & 16.2 \\ \hline & 21 & 6.0 & 6.1 & 0.1 & 7.8 & 15.0 \\ \hline & 22 & 6.2 & 6.2 & 0.0 & 8.2 & 16.9 \\ \hline & 23 & 6.1 & 6.0 & -0.1 & 8.3 & 17.1 \\ \hline & 24 & 6.0 & 6.2 & 0.2 & 8.4 & 16.9 \\ \hline \end{tabular} \begin{tabular}{|c|c|c|c|c|c|c|} \hline Jan. 2020 & 25 & 6.1 & 6.7 & 0.6 & 8.9 & 17.4 \\ \hline & 26 & 5.9 & 6.9 & 1.0 & 9.1 & 17.7 \\ \hline & 27 & 6.0 & 5.8 & -0.2 & 9.3 & 17.6 \\ \hline & 28 & 6.3 & 5.8 & -0.5 & 9.4 & 18.4 \\ \hline & 29 & 6.0 & 6.0 & 0.0 & 9.3 & 18.6 \\ \hline & 30 & 5.7 & 6.7 & 1.0 & 9.4 & 17.4 \\ \hline & 31 & 5.6 & 6.4 & 0.8 & 9.5 & 18.4 \\ \hline & 32 & 6.2 & 7.0 & 0.8 & 9.6 & 17.6 \\ \hline & 33 & 6.4 & 7.2 & 0.8 & 9.7 & 16.7 \\ \hline & 34 & 6.5 & 5.9 & -0.6 & 9.9 & 18.2 \\ \hline & 35 & 6.2 & 6.0 & -0.2 & 9.8 & 18.5 \\ \hline & 36 & 6.7 & 6.2 & -0.5 & 9.9 & 19.1 \\ \hline & 37 & 6.9 & 6.0 & -0.9 & 10.1 & 19.0 \\ \hline Jan.2021 & 38 & 6.9 & 6.3 & -0.6 & 10.2 & 19.0 \\ \hline & 39 & 6.7 & 6.5 & -0.2 & 10.5 & 19.8 \\ \hline & 40 & 7.0 & 6.0 & -1.0 & 10.3 & 19.8 \\ \hline & 41 & 7.1 & 6.1 & -1.0 & 9.9 & 20.0 \\ \hline & 42 & 7.2 & 6.3 & -0.9 & 10.5 & 20.9 \\ \hline & 43 & 7.2 & 6.4 & -0.8 & 10.6 & 19.6 \\ \hline & 44 & 7.3 & 6.5 & -0.8 & 10.5 & 19.5 \\ \hline & 45 & 7.2 & 6.0 & -1.2 & 11.6 & 18.4 \\ \hline & 46 & 7.1 & 6.2 & -0.9 & 10.1 & 19.3 \\ \hline & 47 & 6.9 & 5.9 & -1.0 & 10.3 & 19.3 \\ \hline & 48 & 7.2 & 6.0 & -1.2 & 10.7 & 19.9 \\ \hline & 49 & 7.3 & 6.4 & -0.9 & 10.9 & 20.0 \\ \hline & 7.1 .9 & 6.5 & 0. & 10.0 & 721 \\ \hline \end{tabular} Dutaset: Sheet? Sheet3 \begin{tabular}{|c|c|c|c|c|c|c|} \hline C & D & E & F & G & H & I \\ \hline & 45 & 7.2 & 6.0 & -1.2 & 11.6 & 18.4 \\ \hline & 46 & 7.1 & 6.2 & -0.9 & 10.1 & 19.3 \\ \hline & 47 & 6.9 & 5.9 & -1.0 & 10.3 & 19.3 \\ \hline Jan. 2022 & 48 & 7.2 & 6.0 & -1.2 & 10.7 & 19.9 \\ \hline & 49 & 7.3 & 6.4 & -0.9 & 10.9 & 20.0 \\ \hline & 50 & 7.4 & 6.5 & -0.9 & 10.8 & 20.1 \\ \hline & 51 & 7.5 & 6.5 & -1.0 & 11.1 & 20.1 \\ \hline & 52 & 7.0 & 6.2 & -0.8 & 11.2 & 20.2 \\ \hline & 53 & 6.8 & 6.8 & 0.0 & 11.6 & 21.1 \\ \hline & 54 & 7.4 & 6.9 & -0.5 & 11.5 & 20.6 \\ \hline & 55 & 7.3 & 6.5 & -0.8 & 11.6 & 20.7 \\ \hline & 56 & 7.3 & 6.9 & -0.4 & 11.9 & 21.3 \\ \hline & 57 & 7.2 & 7.0 & -0.2 & 11.8 & 21.4 \\ \hline & 58 & 7.5 & 6.8 & -0.7 & 11.9 & 21.5 \\ \hline & 59 & 7.5 & 6.8 & -0.7 & 12.0 & 21.8 \\ \hline Jan. 2023 & 60 & 7.5 & 6.5 & -1.0 & 11.9 & 21.5 \\ \hline Mar. 2023 & 61 & & & & & \\ \hline & 62 & & & & & \\ \hline & 63 & & & & & \\ \hline \end{tabular} Dataset Sheet2 Sheet3
Step by Step Solution
There are 3 Steps involved in it

Get step-by-step solutions from verified subject matter experts