

Question: 6. with work shown please The Fresh Detergent Case Enterprise Industries produces Fresh, a brand of liquid detergent. In order to more effectively manage its
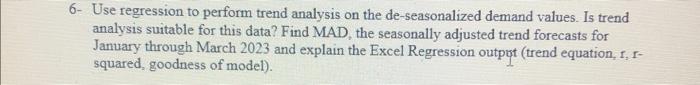
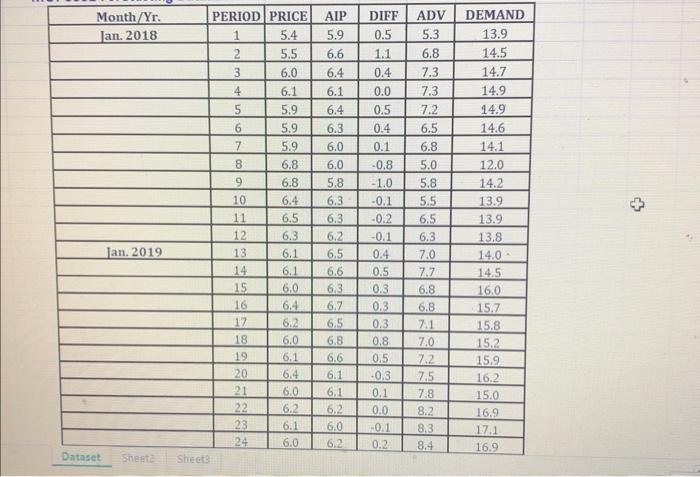
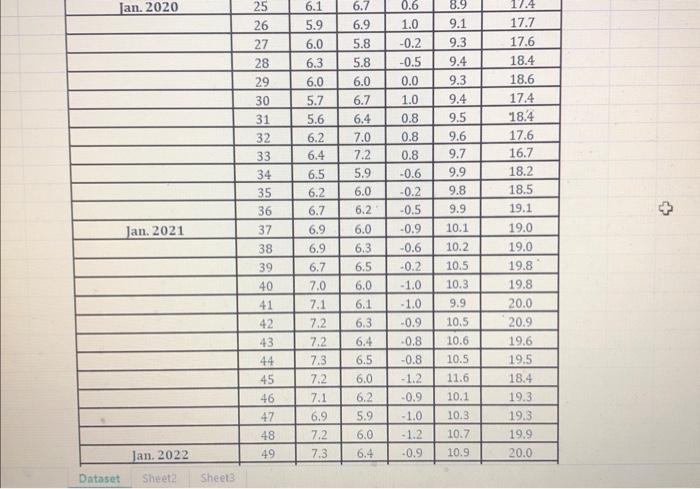
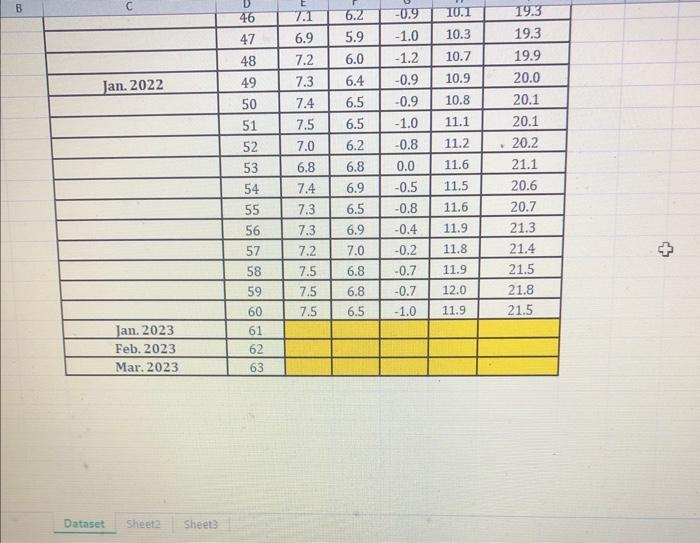
The Fresh Detergent Case Enterprise Industries produces Fresh, a brand of liquid detergent. In order to more effectively manage its inventory, the company would like to better predict demand for Fresh. To develop a prediction model, the company has gathered data concerning demand for Fresh over the last 60 sales periods. Each sales period is defined as one month. The variables are as follows: Demand =Y= demand for a large size bottle of Fresh (in 100,000) Price = the price of Fresh as offered by Ent. Industries AIP= the average industry price ADV= Ent. Industries Advertising Expenditure ( in $100,000) to Promote Fresh in the sales period DIFF = AIP - Price = the "price difference" in the sales period 5- Use regression to perform trend analysis on the de-seasonalized demand values. Is trend analysis suitable for this data? Find MAD, the seasonally adjusted trend forecasts for January through March 2023 and explain the Excel Regression outpot (trend equation, r, rsquared, goodness of model). \begin{tabular}{|c|c|c|c|c|c|c|} \hline Month/Yr. & PERIOD & PRICE & AIP & DIFF & ADV & DEMAND \\ \hline Ian. 2018 & 1 & 5.4 & 5.9 & 0.5 & 5.3 & 13.9 \\ \hline & 2 & 5.5 & 6.6 & 1.1 & 6.8 & 14.5 \\ \hline & 3 & 6.0 & 6.4 & 0.4 & 7.3 & 14.7 \\ \hline & 4 & 6.1 & 6.1 & 0.0 & 7.3 & 14.9 \\ \hline & 5 & 5.9 & 6.4 & 0.5 & 7.2 & 14.9 \\ \hline & 6 & 5.9 & 6.3 & 0.4 & 6.5 & 14.6 \\ \hline & 7 & 5.9 & 6.0 & 0.1 & 6.8 & 14.1 \\ \hline & 8 & 6.8 & 6.0 & -0.8 & 5.0 & 12.0 \\ \hline & 9 & 6.8 & 5.8 & -1.0 & 5.8 & 14.2 \\ \hline & 10 & 6.4 & 6.3 & -0.1 & 5.5 & 13.9 \\ \hline & 11 & 6.5 & 6.3 & -0.2 & 6.5 & 13.9 \\ \hline & 12 & 6.3 & 6.2 & -0.1 & 6.3 & 13.8 \\ \hline & 13 & 6.1 & 6.5 & 0.4 & 7.0 & 14.0 \\ \hline Jan. 2019 & 14 & 6.1 & 6.6 & 0.5 & 7.7 & 1.5 \\ \hline & 15 & 6.0 & 6.3 & 0.3 & 6.8 & 16.0 \\ \hline & 16 & 6.4 & 6.7 & 0.3 & 6.8 & 15.7 \\ \hline & 17 & 6.2 & 6.5 & 0.3 & 7.1 & 15.8 \\ \hline & 18 & 6.0 & 6.8 & 0.8 & 7.0 & 15.2 \\ \hline & 19 & 6.1 & 6.6 & 0.5 & 7.2 & 15.9 \\ \hline & 20 & 6.4 & 6.1 & .0 .3 & 7.5 & 16.2 \\ \hline & 21 & 6.0 & 6.1 & 0.1 & 7.8 & 15.0 \\ \hline & 22 & 6.2 & 6.2 & 0.0 & 8.2 & 16.9 \\ \hline & 23 & 6.1 & 6.0 & -0.1 & 8.3 & 17.1 \\ \hline & 24 & 6.0 & 6.2 & 0.2 & 8.4 & 16.9 \\ \hline \end{tabular} Dotaset Sineate Shects \begin{tabular}{|c|c|c|c|c|c|c|} \hline Jan. 2020 & 25 & 6.1 & 6.7 & 1.9 & 1.4 \\ \hline & 26 & 5.9 & 6.9 & 1.0 & 9.1 & 17.7 \\ \hline & 27 & 6.0 & 5.8 & -0.2 & 9.3 & 17.6 \\ \hline & 28 & 6.3 & 5.8 & -0.5 & 9.4 & 18.4 \\ \hline & 29 & 6.0 & 6.0 & 0.0 & 9.3 & 18.6 \\ \hline & 30 & 5.7 & 6.7 & 1.0 & 9.4 & 17.4 \\ \hline & 31 & 5.6 & 6.4 & 0.8 & 9.5 & 18.4 \\ \hline & 32 & 6.2 & 7.0 & 0.8 & 9.6 & 17.6 \\ \hline & 33 & 6.4 & 7.2 & 0.8 & 9.7 & 16.7 \\ \hline & 34 & 6.5 & 5.9 & -0.6 & 9.9 & 18.2 \\ \hline & 35 & 6.2 & 6.0 & -0.2 & 9.8 & 18.5 \\ \hline & 36 & 6.7 & 6.2 & -0.5 & 9.9 & 19.1 \\ \hline Jan. 2021 & 37 & 6.9 & 6.0 & -0.9 & 10.1 & 19.0 \\ \hline & 38 & 6.9 & 6.3 & -0.6 & 10.2 & 19.0 \\ \hline & 39 & 6.7 & 6.5 & -0.2 & 10.5 & 19.8 \\ \hline & 40 & 7.0 & 6.0 & -1.0 & 10.3 & 19.8 \\ \hline & 41 & 7.1 & 6.1 & -1.0 & 9.9 & 20.0 \\ \hline & 42 & 7.2 & 6.3 & -0.9 & 10.5 & 20.9 \\ \hline & 43 & 7.2 & 6.4 & .0 .8 & 10.6 & 19.6 \\ \hline & 44 & 7.3 & 6.5 & -0.8 & 10.5 & 19.5 \\ \hline & 45 & 7.2 & 6.0 & -1.2 & 11.6 & 18.4 \\ \hline & 46 & 7.1 & 6.2 & -0.9 & 10.1 & 19.3 \\ \hline & 47 & 6.9 & 5.9 & -1.0 & 10.3 & 19.3 \\ \hline & 48 & 7.2 & 6.0 & -1.2 & 10.7 & 19.9 \\ \hline & 49 & 7.3 & 6.4 & .0 .9 & 10.9 & 20.0 \\ \hline \end{tabular} \begin{tabular}{l|l|l} Dataset Sheet? Sheet? \end{tabular} The Fresh Detergent Case Enterprise Industries produces Fresh, a brand of liquid detergent. In order to more effectively manage its inventory, the company would like to better predict demand for Fresh. To develop a prediction model, the company has gathered data concerning demand for Fresh over the last 60 sales periods. Each sales period is defined as one month. The variables are as follows: Demand =Y= demand for a large size bottle of Fresh (in 100,000) Price = the price of Fresh as offered by Ent. Industries AIP= the average industry price ADV= Ent. Industries Advertising Expenditure ( in $100,000) to Promote Fresh in the sales period DIFF = AIP - Price = the "price difference" in the sales period 5- Use regression to perform trend analysis on the de-seasonalized demand values. Is trend analysis suitable for this data? Find MAD, the seasonally adjusted trend forecasts for January through March 2023 and explain the Excel Regression outpot (trend equation, r, rsquared, goodness of model). \begin{tabular}{|c|c|c|c|c|c|c|} \hline Month/Yr. & PERIOD & PRICE & AIP & DIFF & ADV & DEMAND \\ \hline Ian. 2018 & 1 & 5.4 & 5.9 & 0.5 & 5.3 & 13.9 \\ \hline & 2 & 5.5 & 6.6 & 1.1 & 6.8 & 14.5 \\ \hline & 3 & 6.0 & 6.4 & 0.4 & 7.3 & 14.7 \\ \hline & 4 & 6.1 & 6.1 & 0.0 & 7.3 & 14.9 \\ \hline & 5 & 5.9 & 6.4 & 0.5 & 7.2 & 14.9 \\ \hline & 6 & 5.9 & 6.3 & 0.4 & 6.5 & 14.6 \\ \hline & 7 & 5.9 & 6.0 & 0.1 & 6.8 & 14.1 \\ \hline & 8 & 6.8 & 6.0 & -0.8 & 5.0 & 12.0 \\ \hline & 9 & 6.8 & 5.8 & -1.0 & 5.8 & 14.2 \\ \hline & 10 & 6.4 & 6.3 & -0.1 & 5.5 & 13.9 \\ \hline & 11 & 6.5 & 6.3 & -0.2 & 6.5 & 13.9 \\ \hline & 12 & 6.3 & 6.2 & -0.1 & 6.3 & 13.8 \\ \hline & 13 & 6.1 & 6.5 & 0.4 & 7.0 & 14.0 \\ \hline Jan. 2019 & 14 & 6.1 & 6.6 & 0.5 & 7.7 & 1.5 \\ \hline & 15 & 6.0 & 6.3 & 0.3 & 6.8 & 16.0 \\ \hline & 16 & 6.4 & 6.7 & 0.3 & 6.8 & 15.7 \\ \hline & 17 & 6.2 & 6.5 & 0.3 & 7.1 & 15.8 \\ \hline & 18 & 6.0 & 6.8 & 0.8 & 7.0 & 15.2 \\ \hline & 19 & 6.1 & 6.6 & 0.5 & 7.2 & 15.9 \\ \hline & 20 & 6.4 & 6.1 & .0 .3 & 7.5 & 16.2 \\ \hline & 21 & 6.0 & 6.1 & 0.1 & 7.8 & 15.0 \\ \hline & 22 & 6.2 & 6.2 & 0.0 & 8.2 & 16.9 \\ \hline & 23 & 6.1 & 6.0 & -0.1 & 8.3 & 17.1 \\ \hline & 24 & 6.0 & 6.2 & 0.2 & 8.4 & 16.9 \\ \hline \end{tabular} Dotaset Sineate Shects \begin{tabular}{|c|c|c|c|c|c|c|} \hline Jan. 2020 & 25 & 6.1 & 6.7 & 1.9 & 1.4 \\ \hline & 26 & 5.9 & 6.9 & 1.0 & 9.1 & 17.7 \\ \hline & 27 & 6.0 & 5.8 & -0.2 & 9.3 & 17.6 \\ \hline & 28 & 6.3 & 5.8 & -0.5 & 9.4 & 18.4 \\ \hline & 29 & 6.0 & 6.0 & 0.0 & 9.3 & 18.6 \\ \hline & 30 & 5.7 & 6.7 & 1.0 & 9.4 & 17.4 \\ \hline & 31 & 5.6 & 6.4 & 0.8 & 9.5 & 18.4 \\ \hline & 32 & 6.2 & 7.0 & 0.8 & 9.6 & 17.6 \\ \hline & 33 & 6.4 & 7.2 & 0.8 & 9.7 & 16.7 \\ \hline & 34 & 6.5 & 5.9 & -0.6 & 9.9 & 18.2 \\ \hline & 35 & 6.2 & 6.0 & -0.2 & 9.8 & 18.5 \\ \hline & 36 & 6.7 & 6.2 & -0.5 & 9.9 & 19.1 \\ \hline Jan. 2021 & 37 & 6.9 & 6.0 & -0.9 & 10.1 & 19.0 \\ \hline & 38 & 6.9 & 6.3 & -0.6 & 10.2 & 19.0 \\ \hline & 39 & 6.7 & 6.5 & -0.2 & 10.5 & 19.8 \\ \hline & 40 & 7.0 & 6.0 & -1.0 & 10.3 & 19.8 \\ \hline & 41 & 7.1 & 6.1 & -1.0 & 9.9 & 20.0 \\ \hline & 42 & 7.2 & 6.3 & -0.9 & 10.5 & 20.9 \\ \hline & 43 & 7.2 & 6.4 & .0 .8 & 10.6 & 19.6 \\ \hline & 44 & 7.3 & 6.5 & -0.8 & 10.5 & 19.5 \\ \hline & 45 & 7.2 & 6.0 & -1.2 & 11.6 & 18.4 \\ \hline & 46 & 7.1 & 6.2 & -0.9 & 10.1 & 19.3 \\ \hline & 47 & 6.9 & 5.9 & -1.0 & 10.3 & 19.3 \\ \hline & 48 & 7.2 & 6.0 & -1.2 & 10.7 & 19.9 \\ \hline & 49 & 7.3 & 6.4 & .0 .9 & 10.9 & 20.0 \\ \hline \end{tabular} \begin{tabular}{l|l|l} Dataset Sheet? Sheet? \end{tabular}
Step by Step Solution
There are 3 Steps involved in it

Get step-by-step solutions from verified subject matter experts