

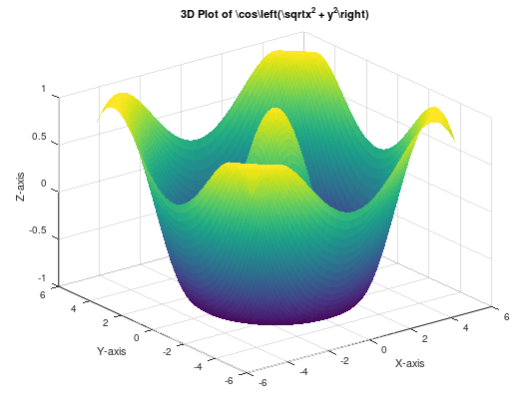
Question: ( 2 ) Write a MATLAB script to generate a 3 D plot for the following function: z = cos ( sqrt ( x ^
Write a MATLAB script to generate a D plot for the following function:
zcossqrtxy
Plot this function in the range for both x and y Label the axes appropriately, provide a title for the graph, and display grid lines.
Step by Step Solution
There are 3 Steps involved in it
1 Expert Approved Answer
Step: 1 Unlock

Question Has Been Solved by an Expert!
Get step-by-step solutions from verified subject matter experts
Step: 2 Unlock
Step: 3 Unlock