

Question: 2. You are constructing a Mean Chart (xbar-chart or x-chart) with the following information: 1 2 3 4 Samples 3 1 2 4 5 12.11
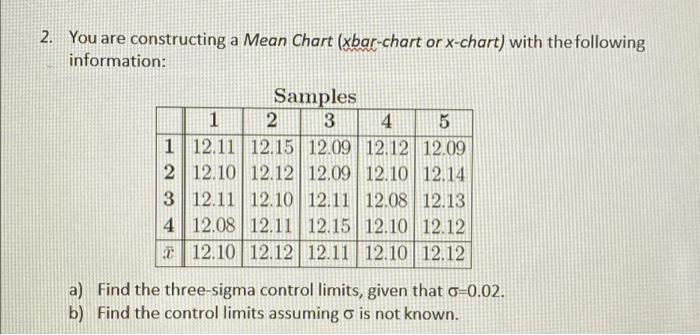
2. You are constructing a Mean Chart (xbar-chart or x-chart) with the following information: 1 2 3 4 Samples 3 1 2 4 5 12.11 12.15 12.09 12.12 12.09 12.10 12.12 12.09 12.10 12.14 12.11 12.10 12.11 12.08 12.13 12.08 12.11 12.15 12.10 12.12 12.10 12.12 12.11 12.10 12.12 a) Find the three-sigma control limits, given that o=0.02. b) Find the control limits assuming is not known.
2. You are constructing a Mean Chart (xbar-chart or x-chart) with the following information: a) Find the three-sigma control limits, given that =0.02. b) Find the control limits assuming is not known
Step by Step Solution
There are 3 Steps involved in it
1 Expert Approved Answer
Step: 1 Unlock

Question Has Been Solved by an Expert!
Get step-by-step solutions from verified subject matter experts
Step: 2 Unlock
Step: 3 Unlock