

Question: Please solve it ASAP. From the Quality and Productivity management Class. This question will be finding the UCL and LCL for the X double bar
| Please solve it ASAP. From the Quality and Productivity management Class.
This question will be finding the UCL and LCL for the X double bar and the Range of a control chart. | |||||||||
| It will be a step by step process beginning with finding the x double bar, the means for the Range, |
| ||||||||
| the Mean control limits and the Range control limits. | |||||||||
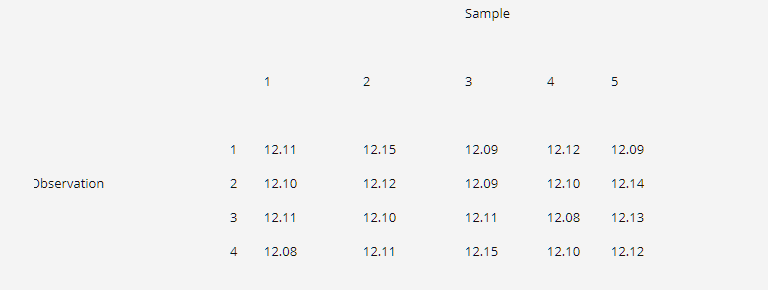
| A quality inspector took 5 samples, each with 4 observations (n = 4), of the length of time for glue to | |||||||||
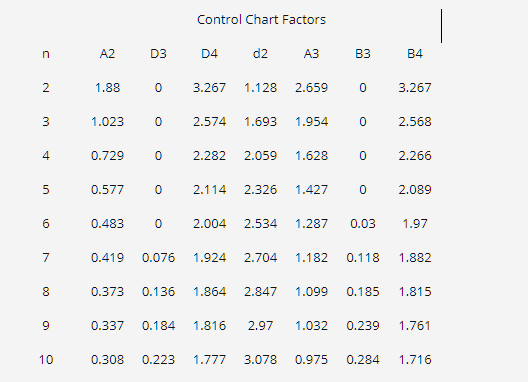
| dry. All values are in minutes. Use the information below and to find the X double bar (mean of the means), Range, UCL and LCL for the Means and the Range control charts. Are the control charts in or out of control. |
|
| |||||||
| 1. X double = 2. Range = 3. UCL and LCL for the means 4. UCL and LCL for the Range 5. Is the X double control chart in control? 6. Is the Range control chart in control?
| |||||||||
Step by Step Solution
There are 3 Steps involved in it

Get step-by-step solutions from verified subject matter experts