

Question: 20 2. Use the table from sheet (Table 2.1) to answer the following questions. - The table displays the daily production data for 10 sewing
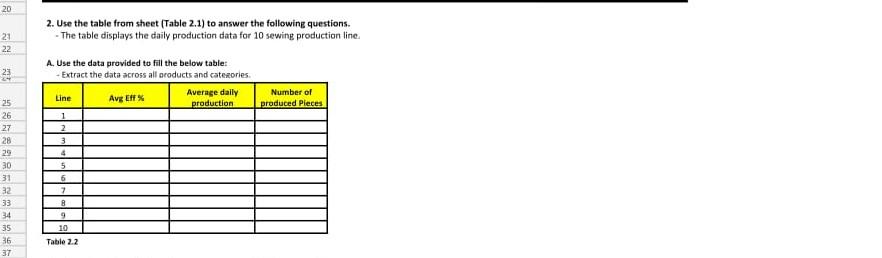
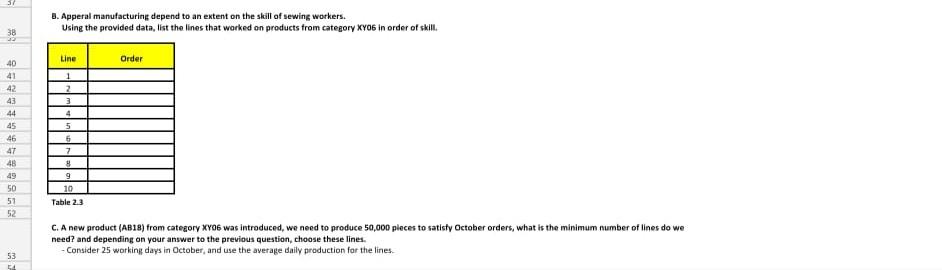
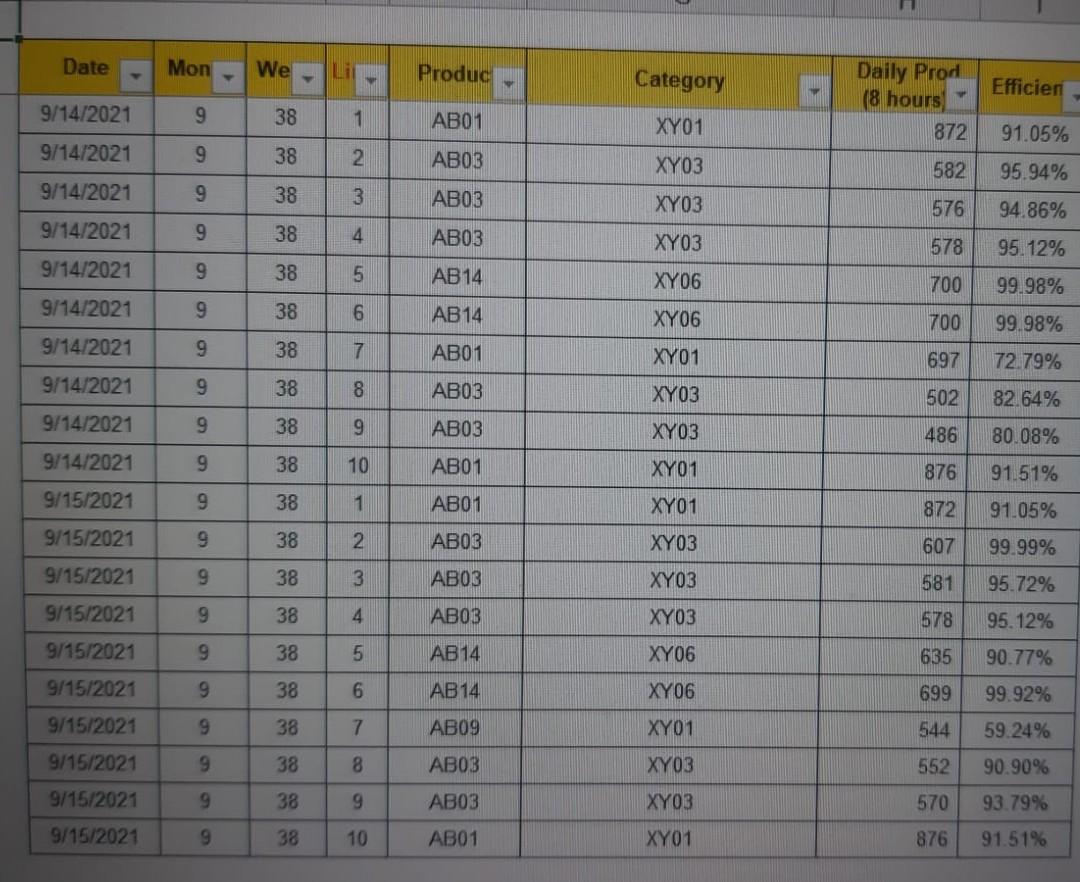
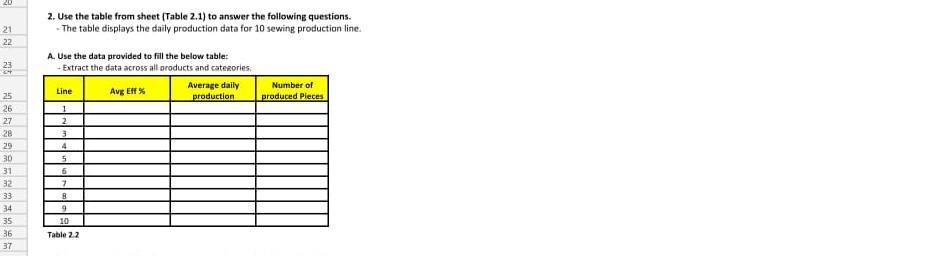
20 2. Use the table from sheet (Table 2.1) to answer the following questions. - The table displays the daily production data for 10 sewing production line. 21 22 23 Number of produced Pieces A. Use the data provided to fill the below table: Extract the data across all products and categories Line Average daily Avg Eff production 1 2 3 4 25 26 27 28 25 30 5 6 7 8 33 34 35 36 9 10 Table 2.2 37 3. Apperal manufacturing depend to an extent on the skill of sewing workers. Using the provided data, list the lines that worked on products from category XYO6 in order of skill 38 Line Order S 40 41 42 43 44 45 46 47 48 49 50 51 52 1 2 3 4 5 5 7 8 9 10 Table 2.3 C. A new product (AB18) from category XYO6 was introduced, we need to produce 50,000 pleces to satisfy October orders, what is the minimum number of lines do we need? and depending on your answer to the previous question, choose these lines. Consider 25 working days in October, and use the average daily production for the lines 53 Date Mon We Lil Produc + Category Efficier Daily Prod (8 hours 872 9/14/2021 9 38 1 AB01 XY01 91.05% 9/14/2021 9 38 2 AB03 XY03 582 95.94% 9/14/2021 9 38 3 AB03 XY03 576 94.86% 9/14/2021 9 38 4 AB03 XY03 578 95.12% 9/14/2021 9 38 5 AB14 XY06 700 99.98% 9/14/2021 9 38 6 AB14 XY06 700 99.98% 9/14/2021 9 38 7 AB01 XY01 697 72.79% % 9/14/2021 9 38 8 AB03 XY03 502 82.64% 9/14/2021 9 38 9 AB03 XY03 486 80.08% 9/14/2021 9 38 10 AB01 XY01 876 91.51% 9/15/2021 9 38 1 AB01 XY01 872 91.05% 9/15/2021 9 38 2 AB03 XY03 607 99.99% 9/15/2021 9 38 3 AB03 XY03 581 95.72% 9/15/2021 9 38 4 AB03 XY03 578 95.12% 9/15/2021 9 38 5 AB14 XY06 635 90.77% 9/15/2021 9 38 6 AB 14 XY06 699 99.92% 9/15/2021 9 38 7 AB09 XY01 544 59.24% 9/15/2021 9 38 8 AB03 XY03 552 90.90% 9/15/2021 9 38 9 AB03 XY03 570 93.79% 9/15/2021 9 38 10 AB01 XY01 876 91.51% 20 2. Use the table from sheet (Table 2.1) to answer the following questions. The table displays the daily production data for 10 sewing production line 21 22 23 Number of produced Pieces 25 26 27 28 29 30 31 32 33 34 35 36 37 A. Use the data provided to fill the below table: Extract the data across all products and categories Line Average daily Avg EF% production 1 2 3 4 5 6 2 B 9 10 Table 22
Step by Step Solution
There are 3 Steps involved in it
1 Expert Approved Answer
Step: 1 Unlock

Question Has Been Solved by an Expert!
Get step-by-step solutions from verified subject matter experts
Step: 2 Unlock
Step: 3 Unlock