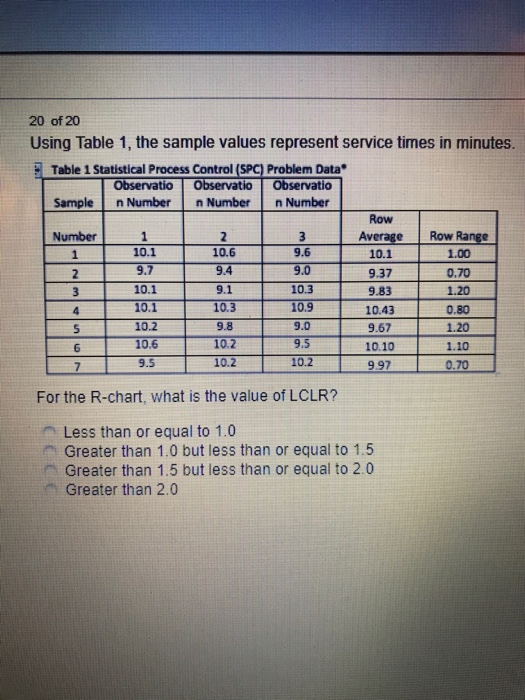
Question: 20 of 20 Using Table 1, the sample values represent service times in minutes. Table 1 Statistical Process Control (SPC) Problem Data Observatio Observatio Observatio

20 of 20 Using Table 1, the sample values
20 of 20 Using Table 1, the sample values represent service times in minutes. Table 1 Statistical Process Control (SPC) Problem Data Observatio Observatio Observatio Sample n Number n Number n Number Row Number Average Row Range 10.6 9.6 10.1 1.00 9.0 9.37 0.70 10.1 10.3 9.83 1.20 10.1 10.9 10.43 0.50 10.2 9.67 1.20 10. 101 .10 9.5 10.2 10.2 9.97 0.70 w 9.0 10.6 102 95 For the R-chart, what is the value of LCLR? Less than or equal to 1.0 Greater than 1.0 but less than or equal to 1.5 Greater than 1.5 but less than or equal to 2.0 Greater than 2.0

Step by Step Solution

There are 3 Steps involved in it

1 Expert Approved Answer
Step: 1 Unlock blur-text-image
Question Has Been Solved by an Expert!

Get step-by-step solutions from verified subject matter experts

Step: 2 Unlock
Step: 3 Unlock

Students Have Also Explored These Related General Management Questions!