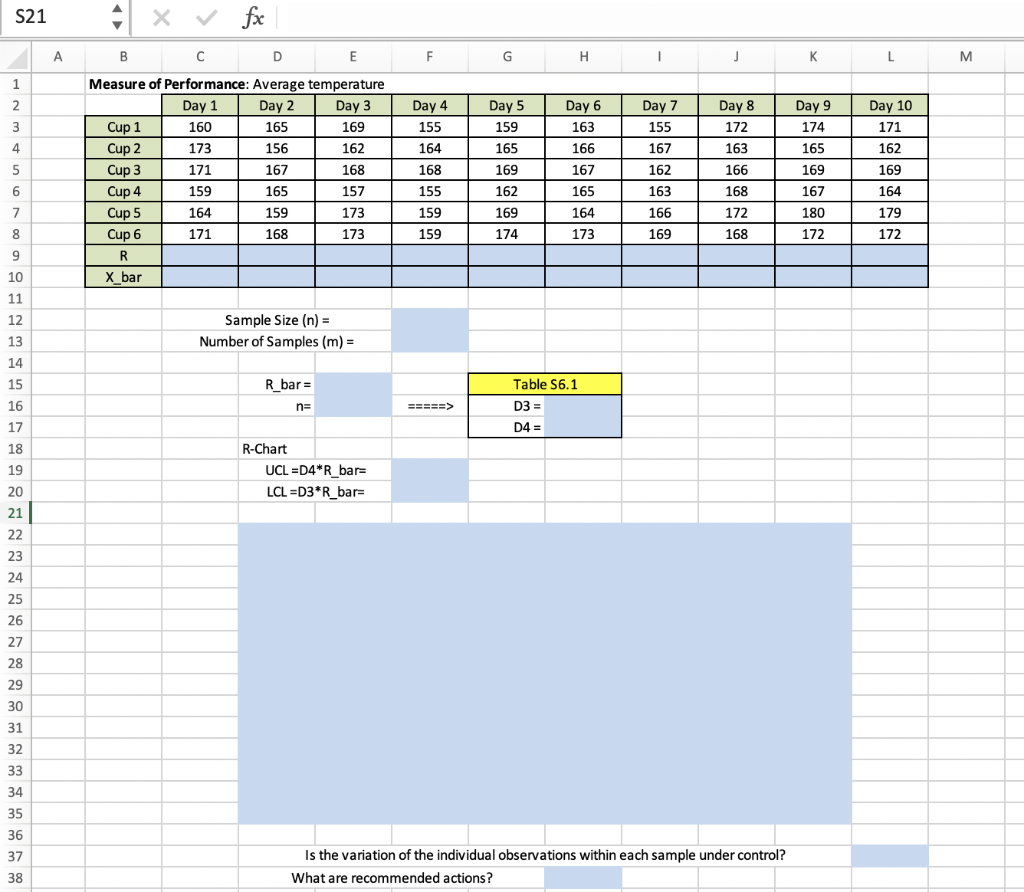
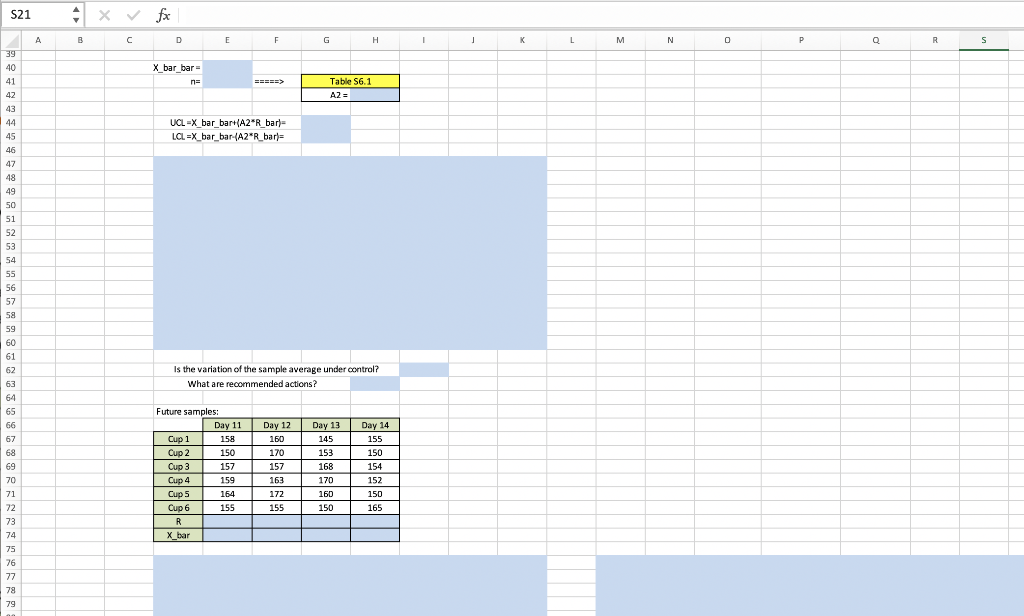
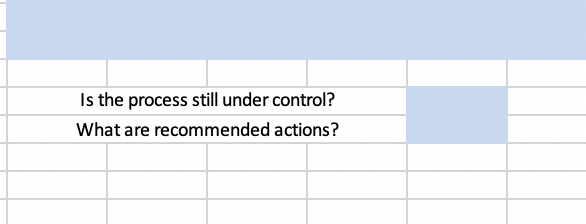
Question: Problem 2!!!! Problem 1 The table below shows the actual temperature (in degrees Fahrenheit) of 6 cups of coffee bought from a gourmet coffee shop

Problem 2!!!!Problem 2!!!! Problem 1 The table below shows theProblem 2!!!! Problem 1 The table below shows theProblem 2!!!! Problem 1 The table below shows theProblem 2!!!! Problem 1 The table below shows the

Problem 1 The table below shows the actual temperature (in degrees Fahrenheit) of 6 cups of coffee bought from a gourmet coffee shop on 10 consecutive days. Federal health regulations require that coffee temperatures be between certain limits. Assuming the standard deviation for the temperature population is 9, use statistical process control (SPC) method to find the control limits for the average temperature of each sample and verify if the process is under control. Day 1 160 Day 2 165 Day 3 169 Day 4 155 Day 5 159 Day 6 163 166 Day 7 155 Day 10 171 Day 8 172 163 166 173 162 164 165 167 162 156 167 Day 9 174 165 169 167 180 171 168 168 169 167 162 Cup 1 Cup 2 Cup 3 Cup 4 Cup 5 Cup 6 169 159 155 165 164 165 159 157 173 162 169 163 166 168 172 164 159 164 179 171 168 173 159 174 173 169 168 172 172 Recently the following data were collected: Day 11 158 Day 12 160 Day 13 145 Day 14 155 150 170 153 150 157 168 154 Cup 1 Cup 2 Cup 3 Cup 4 Cup 5 Cup 6 157 159 163 152 164 172 170 160 150 150 165 155 155 Using SPC method, find out whether the process is still under control. Problem 2 Solve the previous problem assuming that we do not know the standard deviation of the temperature population. S21 fx A F G H H 1 j K L 3 B D E Measure of Performance: Average temperature Day 1 Day 2 Day 3 Cup 1 160 165 169 Cup 2 173 156 162 Cup 3 171 167 168 Cup 4 159 165 157 Cup 5 164 159 173 Cup 6 171 168 173 R X_bar Day 4 155 164 168 155 159 159 Day 5 159 165 169 162 Day 6 163 166 167 165 164 173 Day 7 155 167 162 163 166 169 Day 8 172 163 166 168 172 168 Day 9 174 165 169 167 180 172 Day 10 171 162 169 164 179 172 169 174 1 2 3 4 5 6 7 7 8 9 9 10 11 12 13 14 15 16 17 18 19 20 21 22 23 24 Sample Size (n) = Number of Samples (m) = R_bar = n= =====> Table 56.1 D3 = D4 = R-Chart UCL =D4*R_bar= LCL =D3*R_bar= 25 26 27 28 29 30 31 32 33 34 35 36 37 38 Is the variation of the individual observations within each sample under control? What are recommended actions? S21 XV fx A B c D E F G H 1 K L L M N 0 P 0 R S 39 40 X_bar_bar n= ESSES 41 42 Table 56.1 A2 = UCL X_bar_bar+{A2R bar- LCL =X_bar_bar{A2R bar) 43 44 45 46 47 48 49 50 51 52 53 54 55 56 57 58 59 60 61 62 63 64 65 66 Is the variation of the sample average under control? What are recommended actions? 67 68 69 70 Future samples: Day 11 Cup 1 158 Cup 2 150 Cup 3 157 Cup 4 159 Cup 5 164 Cup 6 155 R R X_bar Day 12 160 170 157 163 172 155 Day 13 145 15 168 170 160 150 Day 14 155 150 154 152 150 165 71 72 73 74 75 76 77 78 79 Is the process still under control? What are recommended actions

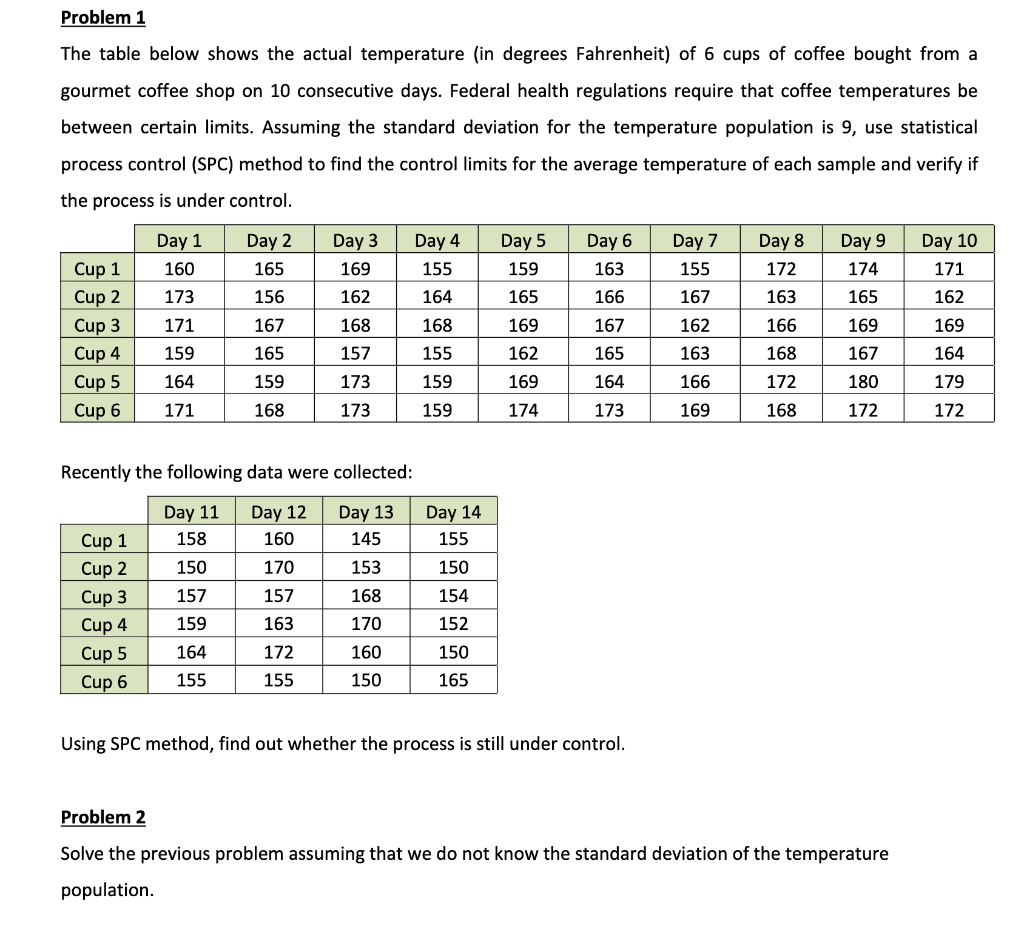
Step by Step Solution

There are 3 Steps involved in it

1 Expert Approved Answer
Step: 1 Unlock blur-text-image
Question Has Been Solved by an Expert!

Get step-by-step solutions from verified subject matter experts

Step: 2 Unlock
Step: 3 Unlock

Students Have Also Explored These Related General Management Questions!