

Question: 2001 2002 2003 2001 2002 2003 First Quarter 2004 First Quarter 2004 Cash $1.697 $2.013 $2.694 Net sales Cost of goods sold Beginning inventory Purchases
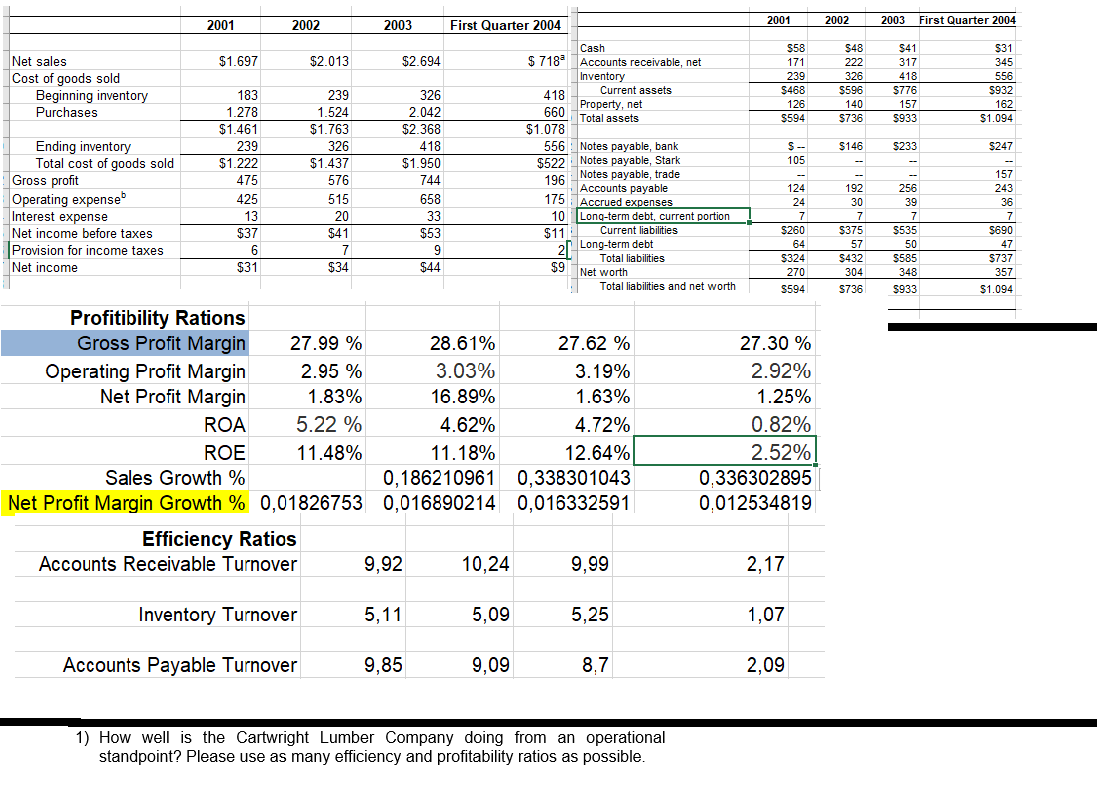
2001 2002 2003 2001 2002 2003 First Quarter 2004 First Quarter 2004 Cash $1.697 $2.013 $2.694 Net sales Cost of goods sold Beginning inventory Purchases $58 171 239 $468 126 $594 $48 222 326 $596 140 $736 $41 317 418 $776 157 $933 $31 345 556 $932 162 $1.094 239 1.524 $146 $233 $247 Ending inventory Total cost of goods sold Gross profit Operating expense Interest expense Net income before taxes Provision for income taxes Net income S- 105 183 1.278 $1.461 239 $1.222 475 425 13 $37 6 $31 $1.763 326 $1.437 576 515 20 $41 7 $34 $ 718 Accounts receivable, net Inventory Current assets 418 Property, net 660 Total assets $1.078 556 : Notes payable, bank $522 Notes payable, Stark 196 Notes payable, trade Accounts payable 175 Accrued expenses 10 Long-term debt, current portion $11 Current liabilities 21 Long-term debt Total liabilities 326 2.042 $2.368 418 $1.950 744 658 33 $53 9 $44 124 24 7 $260 64 $324 270 S594 192 30 7 $375 57 $432 304 S736 256 39 7 $535 50 5585 348 $933 157 243 36 7 $690 47 $737 357 $1.094 $9 Net worth Total liabilities and net worth Profitibility Rations Gross Profit Margin 27.99 % 28.61% 27.62 % Operating Profit Margin 2.95 % 3.03% 3.19% Net Profit Margin 1.83% 16.89% 1.63% ROA 5.22 % 4.62% 4.72% ROE 11.48% 11.18% 12.64% Sales Growth % 0,186210961 0,338301043 Net Profit Margin Growth % 0,01826753 0,016890214 0,016332591 Efficiency Ratios Accounts Receivable Turnover 9,92 10,24 9,99 27.30 % 2.92% 1.25% 0.82% 2.52% 0.336302895 0.012534819 2,17 Inventory Turnover 5,11 5,09 5,25 1,07 Accounts Payable Turnover 9,85 9,09 8.7 2,09 1) How well is the Cartwright Lumber Company doing from an operational standpoint? Please use as many efficiency and profitability ratios as possible. 2001 2002 2003 2001 2002 2003 First Quarter 2004 First Quarter 2004 Cash $1.697 $2.013 $2.694 Net sales Cost of goods sold Beginning inventory Purchases $58 171 239 $468 126 $594 $48 222 326 $596 140 $736 $41 317 418 $776 157 $933 $31 345 556 $932 162 $1.094 239 1.524 $146 $233 $247 Ending inventory Total cost of goods sold Gross profit Operating expense Interest expense Net income before taxes Provision for income taxes Net income S- 105 183 1.278 $1.461 239 $1.222 475 425 13 $37 6 $31 $1.763 326 $1.437 576 515 20 $41 7 $34 $ 718 Accounts receivable, net Inventory Current assets 418 Property, net 660 Total assets $1.078 556 : Notes payable, bank $522 Notes payable, Stark 196 Notes payable, trade Accounts payable 175 Accrued expenses 10 Long-term debt, current portion $11 Current liabilities 21 Long-term debt Total liabilities 326 2.042 $2.368 418 $1.950 744 658 33 $53 9 $44 124 24 7 $260 64 $324 270 S594 192 30 7 $375 57 $432 304 S736 256 39 7 $535 50 5585 348 $933 157 243 36 7 $690 47 $737 357 $1.094 $9 Net worth Total liabilities and net worth Profitibility Rations Gross Profit Margin 27.99 % 28.61% 27.62 % Operating Profit Margin 2.95 % 3.03% 3.19% Net Profit Margin 1.83% 16.89% 1.63% ROA 5.22 % 4.62% 4.72% ROE 11.48% 11.18% 12.64% Sales Growth % 0,186210961 0,338301043 Net Profit Margin Growth % 0,01826753 0,016890214 0,016332591 Efficiency Ratios Accounts Receivable Turnover 9,92 10,24 9,99 27.30 % 2.92% 1.25% 0.82% 2.52% 0.336302895 0.012534819 2,17 Inventory Turnover 5,11 5,09 5,25 1,07 Accounts Payable Turnover 9,85 9,09 8.7 2,09 1) How well is the Cartwright Lumber Company doing from an operational standpoint? Please use as many efficiency and profitability ratios as possible
Step by Step Solution
There are 3 Steps involved in it

Get step-by-step solutions from verified subject matter experts