

Question: 2006 54 2007 65 26. From the data given above, the forecast for the year 2005 (in 0008) is A) 39.60 units B) 40.72 units
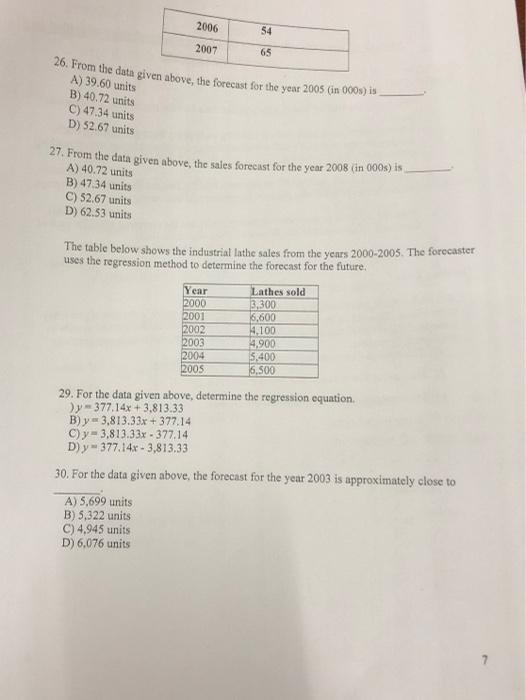
2006 54 2007 65 26. From the data given above, the forecast for the year 2005 (in 0008) is A) 39.60 units B) 40.72 units C) 47.34 units D) 52.67 units 27. From the data given above, the sales forecast for the year 2008 (in 000) is A) 40.72 units B) 47.34 units C) 52.67 units D) 62.53 units The table below shows the industrial lathe sales from the years 2000-2005. The forecaster uses the regression method to determine the forecast for the future. Year 2000 2001 2002 2003 2004 2005 Lathes sold 3,300 6,600 4.100 4,900 5,400 6,500 29. For the data given above, determine the regression equation. y 377.14x + 3.813.33 B) y = 3,813.33x + 377.14 C) y - 3,813.33x - 377.14 D) y - 377.14x - 3,813.33 30. For the data given above, the forecast for the year 2003 is approximately close to A) 5,699 units B) 5,322 units C)4,945 units D) 6.076 units 2006 54 2007 65 26. From the data given above, the forecast for the year 2005 (in 0008) is A) 39.60 units B) 40.72 units C) 47.34 units D) 52.67 units 27. From the data given above, the sales forecast for the year 2008 (in 000) is A) 40.72 units B) 47.34 units C) 52.67 units D) 62.53 units The table below shows the industrial lathe sales from the years 2000-2005. The forecaster uses the regression method to determine the forecast for the future. Year 2000 2001 2002 2003 2004 2005 Lathes sold 3,300 6,600 4.100 4,900 5,400 6,500 29. For the data given above, determine the regression equation. y 377.14x + 3.813.33 B) y = 3,813.33x + 377.14 C) y - 3,813.33x - 377.14 D) y - 377.14x - 3,813.33 30. For the data given above, the forecast for the year 2003 is approximately close to A) 5,699 units B) 5,322 units C)4,945 units D) 6.076 units
Step by Step Solution
There are 3 Steps involved in it

Get step-by-step solutions from verified subject matter experts