

Question: 2015 TABLE 2.5 2012-2016 Financial Statement Data and Stock Price Data for Mydeco Corp. Mydeco Corp. 2012-2016 (All data as of fiscal year end; in
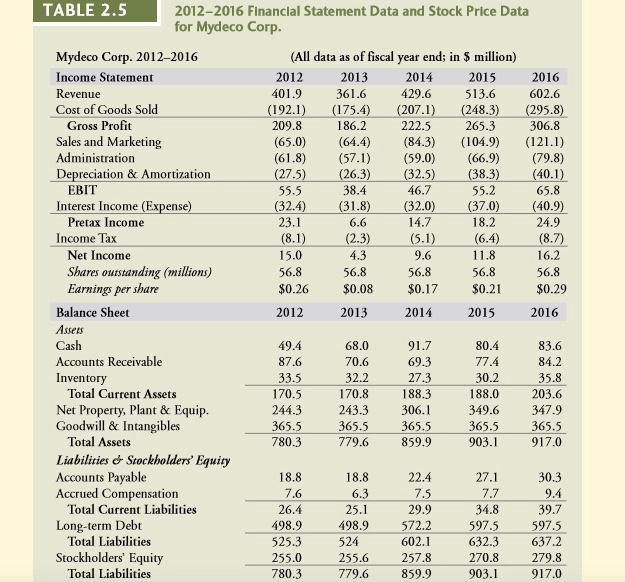
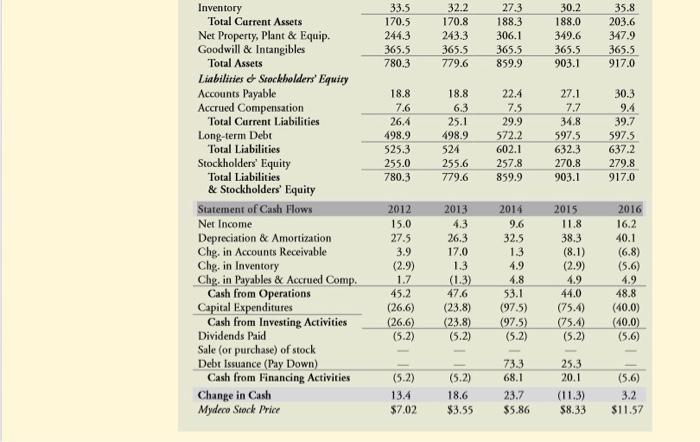
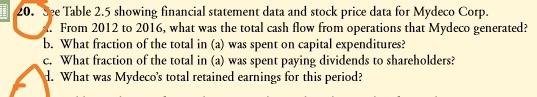
2015 TABLE 2.5 2012-2016 Financial Statement Data and Stock Price Data for Mydeco Corp. Mydeco Corp. 2012-2016 (All data as of fiscal year end; in $ million) Income Statement 2012 2013 2014 2016 Revenue 401.9 361.6 429.6 513.6 602.6 Cost of Goods Sold (192.1) (175.4) (207.1) (248.3) (295.8) Gross Profit 209.8 186.2 222.5 265.3 306.8 Sales and Marketing (65.0) (64.4) (84.3) (104.9) (121.1) Administration (61.8) (57.1) (59.0) (66.9) (79.8) Depreciation & Amortization (27.5) (26.3) (32.5) (38.3) (40.1) EBIT 55.5 38.4 46.7 55.2 65.8 Interest Income (Expense) (32.4) (31.8) (32.0) (37.0) (40.9) Pretax Income 23.1 6.6 14.7 18.2 24.9 Income Tax (8.1) (2.3) (5.1) (6.4) (8.7) Net Income 15.0 4.3 9.6 11.8 16.2 Shares outstanding (millions) 56.8 56.8 56.8 56.8 56.8 Earnings per share $0.26 $0.08 $0.17 $0.21 $0.29 Balance Sheet 2012 2013 2014 2015 2016 Assets Cash 49.4 68.0 91.7 80.4 83.6 Accounts Receivable 87.6 70.6 69.3 77.4 84.2 Inventory 33.5 32.2 27.3 30.2 35.8 Total Current Assets 170.5 170.8 188.3 188.0 203.6 Net Property, Plant & Equip. 244.3 243.3 306.1 349.6 347.9 Goodwill & Intangibles 365.5 365.5 365.5 365.5 365.5 Total Assets 780.3 779.6 859.9 903.1 917.0 Liabilities Stockholders' Equity Accounts Payable 18.8 18.8 22.4 27.1 30.3 Accrued Compensation 7.6 6.3 7.5 7.7 9.4 Total Current Liabilities 26.4 25.1 29.9 34.8 39.7 Long-term Debt 498.9 498.9 572.2 597.5 597.5 Total Liabilities 525.3 524 602.1 632.3 637.2 Stockholders' Equity 255.0 255.6 257.8 270.8 279.8 Total Liabilities 780.3 779.6 859.9 903.1 917.0 33.5 170.5 244.3 365.5 780.3 32.2 170.8 243.3 365.5 779.6 27.3 188.3 306.1 365.5 859.9 30.2 188.0 349.6 365.5 903.1 35.8 203.6 347.9 365.5 917.0 18.8 7.6 26.4 498.9 525.3 255.0 780.3 18.8 6.3 25.1 498.9 524 255.6 779.6 22.4 7.5 29.9 572.2 602.1 257.8 859.9 27.1 7.7 34.8 5975 6323 270.8 903.1 30.3 9.4 39.7 597.5 637.2 279.8 917.0 Inventory Total Carrent Assets Net Property, Plant & Equip. Goodwill & Intangibles Total Assets Liabilities - Stockholders' Equity Accounts Payable Accrued Compensation Total Current Liabilities Long-term Debt Total Liabilities Stockholders' Equity Total Liabilities & Stockholders' Equity Statement of Cash Flows Net Income Depreciation & Amortization Chg. in Accounts Receivable Chg. in Inventory Chg. in Payables & Accrued Comp. Cash from Operations Capital Expenditures Cash from Investing Activities Dividends Paid Sale (or purchase) of stock Debt Issuance (Pay Down) Cash from Financing Activities Change in Cash Mydeco Stock Price 2012 15.0 27.5 3.9 (2.9) 1.7 45.2 (26.6) (266) (5.2) 2013 4.3 26.3 17.0 1.3 (1.3) 47.6 (23.8) (23.8) (5.2) 2014 9.6 32.5 13 4.9 4.8 53.1 (97.5) (97.5) (5.2) 2015 11.8 38.3 (8.1) (2.9) 4.9 44.0 (75.4) (75.4) (5.2) 2016 16.2 40.1 (6.8) (5.6) 4.9 48.8 (40.0) (40.0) (5.6) 25.3 20.1 (5.2) 13.4 $7.02 (5.2) 18.6 $3.55 73.3 68.1 23.7 $5.86 (11.3) $8.33 (5.6) 3.2 $11.57 20. See Table 2.5 showing financial statement data and stock price data for Mydeco Corp. From 2012 to 2016, what was the total cash flow from operations that Mydeco generated? b. What fraction of the total in (a) was spent on capital expenditures? c. What fraction of the total in (a) was spent paying dividends to shareholders? 1. What was Mydeco's total retained earnings for this period
Step by Step Solution
There are 3 Steps involved in it

Get step-by-step solutions from verified subject matter experts